The Bitcoin market is staging a classic battle between bulls and bears. After reaching a historic high of approximately $123,250, BTC corrected 7.50% within three weeks, briefly dipping below the $113,000 mark. However, analysts see a more essential trend through the surface—the strong support of the 50-day Exponential Moving Average (EMA) coinciding with the Inverse Head and Shoulders neckline, forming a 'perfect bottom' technical structure. Meanwhile, on-chain data shows that the $9.6 billion sell-off by the 'Old Whale' is not bearish; instead, it parallels the profit-taking after the ETF approval in March 2024 and Trump's victory at the end of 2024, which historically led to stronger market rallies.
I. Technical Resonance: Dual Support Levels Build the Launch Pad for the Bull Market
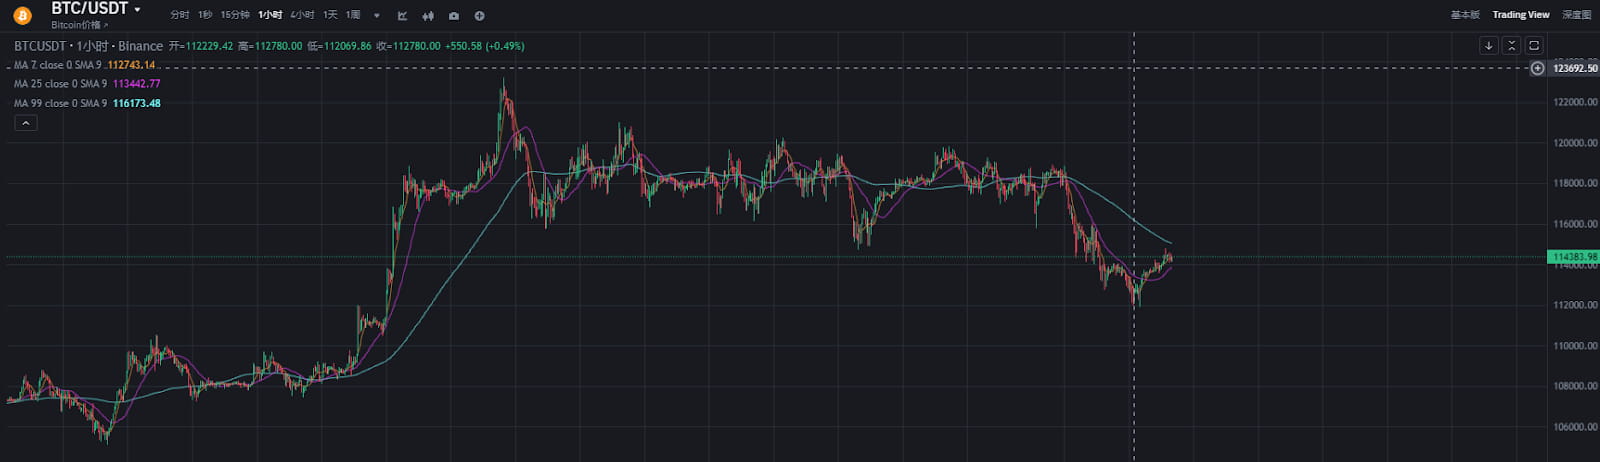
BTC/USD Daily Price Chart.
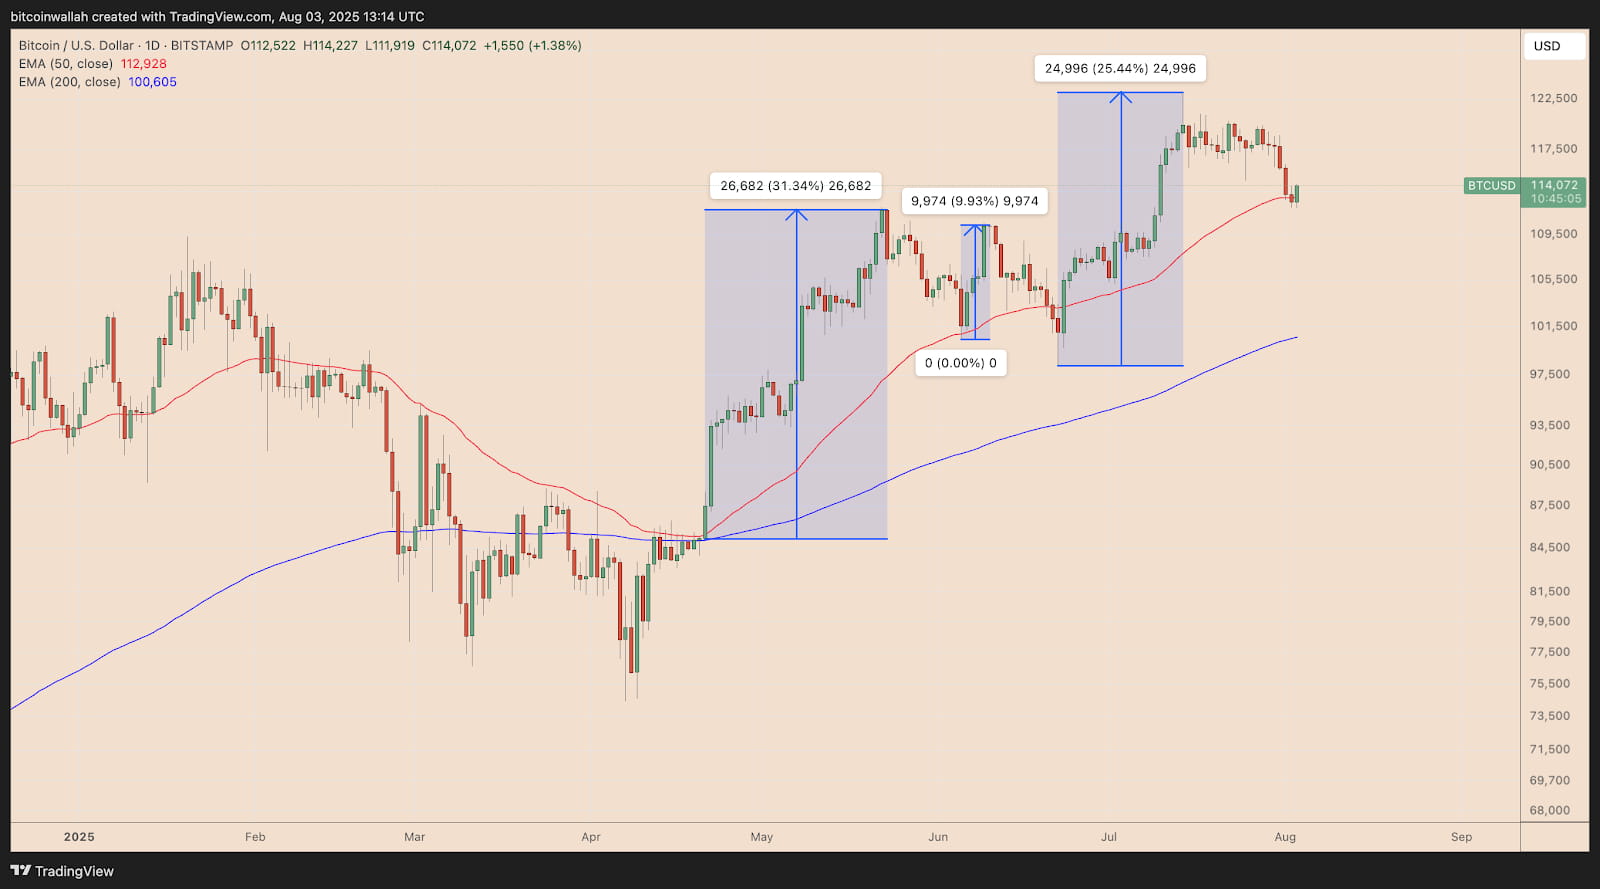
The daily chart of Bitcoin is outlining a typical bull market correction path. On Sunday (August 3), the price quickly reclaimed the key position after briefly dropping below the 50-day EMA (red wavy line), mirroring the technical script from June—when a similar drop triggered a rapid 25% rebound. This moving average has become a stronghold for bulls since the 2025 bull market, with three pullbacks converting into upward momentum.
BTC/USD Daily Price Chart.
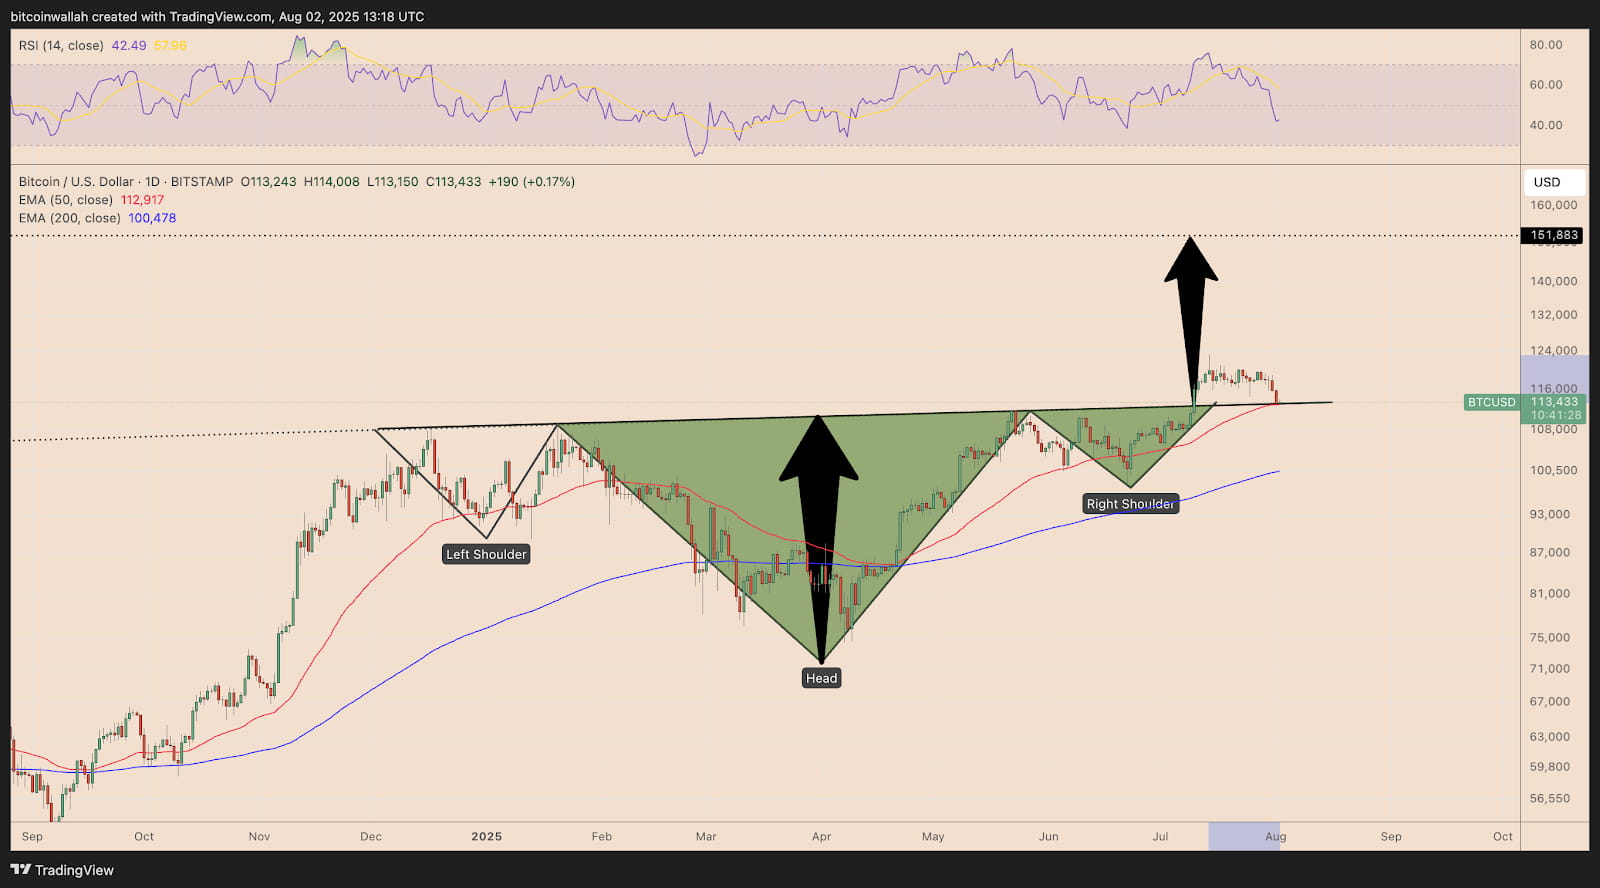
More noteworthy is the technical resonance forming between the 50-day EMA and the Inverse Head and Shoulders (IH&S) neckline. After breaking through this neckline at the end of July, the current pullback is seen as a retest of the breakout's validity. If it successfully holds, it will open up an upward space with a measured target of $148,250. This target resonates with the weekly round bottom pattern (targeting $140,000) and the bull flag breakout (targeting $150,000).
The market structure has quietly shifted: The CME $115,000 gap has been filled, high leverage positions have been cleared, and financing rates have returned to a healthy range, clearing obstacles for 'net long upward'.
II. Whale Game: The Bull Market Cooling Mechanism Behind the $9.6 Billion Sell-off
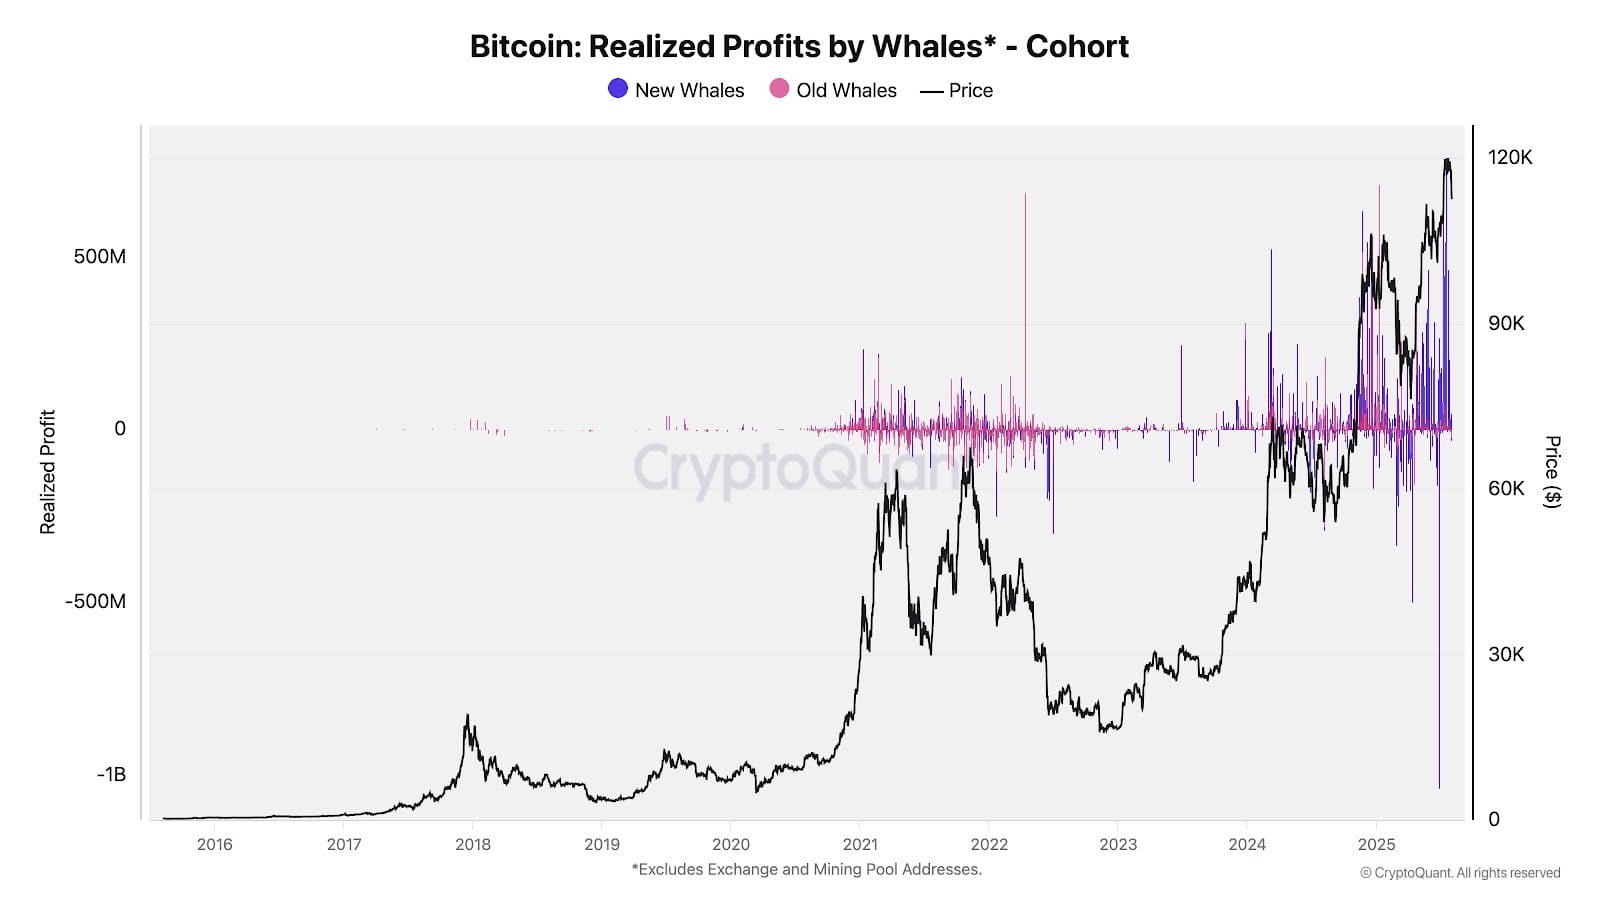
On-chain data reveals the strategic layout of institutional-level capital. CryptoQuant monitoring shows that this round of bull market has seen three concentrated profit-taking waves from whales.
March 2024: After the approval of the U.S. spot Bitcoin ETF, a net inflow of $8.5 billion stimulated the first round of profit-taking.
November 2024: Trump's Victory Drives BTC to Break $100,000, Triggering the Second Round of Profit-taking
July 2025: After a historic breakthrough of $120,000, the 'Old Whale' transfers 80,000 BTC (approximately $9.6 billion) in one go.
These 'whale capitulation' events are accompanied by 2-4 months of consolidation periods, acting as a natural cooling valve for the market.
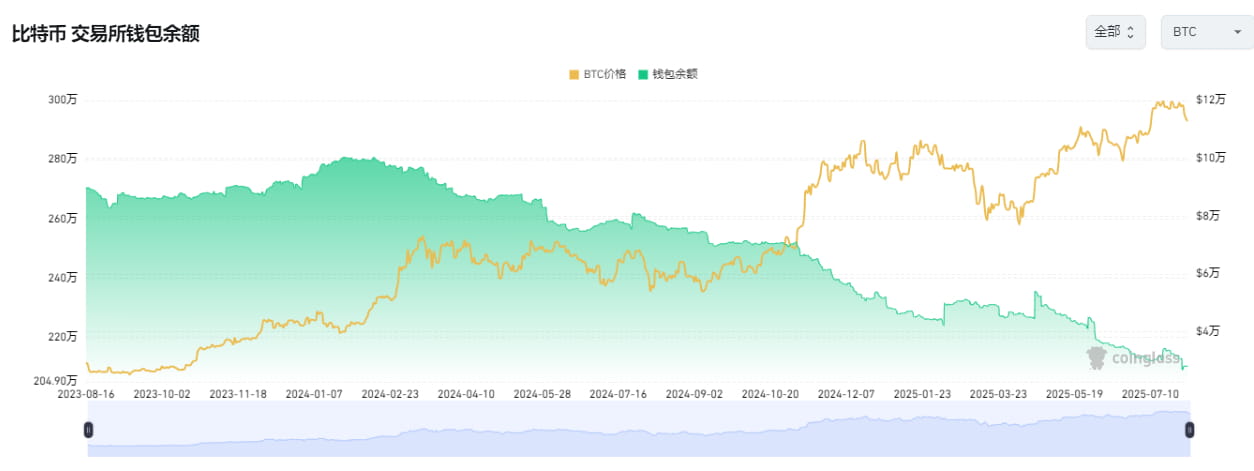
However, current data indicates that whales continue to accumulate: addresses holding 10-10,000 BTC have increased their holdings by 83,105 BTC over the past 30 days, with exchange balances dropping to 2.44 million (a six-year low), showing that long-term holders are reluctant to sell.
III. Macroeconomics and Capital: The Liquidity Tailwind in the Interest Rate Cut Cycle
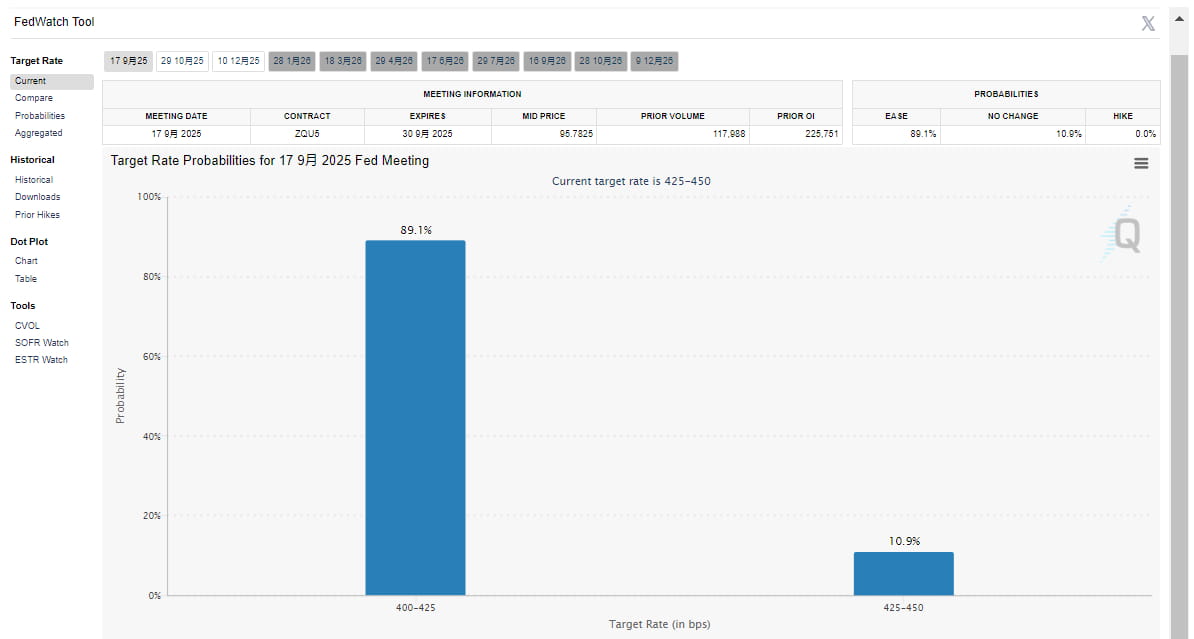
The logic behind Bitcoin's rise is deeply tied to global monetary policy. The U.S. July non-farm data 'shocked' (with only 73,000 new jobs and the unemployment rate rising to 4.2%), completely reversing market expectations, with the probability of an interest rate cut by the Federal Reserve soaring to 80%. This confirms the previous prediction in the Xueqiu column: under the combination of $31 trillion in Treasury issuance and the interest rate cut cycle, Bitcoin will become a beneficiary of the 'fiscal dominance' paradigm.
Capital inflows show a structural transformation:
ETF Continues to Attract Capital: Spot Bitcoin ETF sees a net inflow of $2.9 billion in two weeks, BlackRock holds over 700,000 BTC, and management fee revenue outpaces the S&P 500 ETF.
Corporate Reserve Monetization: Mexican hotel giant invests $500 million to hoard BTC, Japan's Metaplanet exceeds 2,200 coins in holdings, and traditional industries like healthcare and chips follow suit.
Ethereum ETF's Comeback: Zero outflows for 10 consecutive weeks, attracting a record $3.5 billion in a single month, with staking yields (annualized 4%) making it a 'digital bond'.
IV. $150,000 Target: Resonance of Historical Cycles and Technical Patterns
Multiple technical models point to a target range of $140,000 - $150,000:
Round Bottom Theory: After breaking the neckline at $106,660 on the daily level, the measured target is $140,000 (37% higher than the current price).
VIX Correlation Model: When the volatility index is below 18 in a 'risk-on' environment, Bitcoin network economist Timothy Peterson predicts a target of $135,000 in the next 100 days (95% accuracy).
Halving Cycle Rule: After the fourth halving in May 2024, history shows that a bull market peak will occur in 12-18 months, with October 2025 becoming a key time window.
The essential logic supporting these targets lies in Bitcoin's 'asset repricing': it has transformed from a speculative fringe asset to a tool for corporate balance sheet allocation. As MicroStrategy holds 190,000 BTC and BlackRock incorporates it into its trillion-dollar asset management empire, Bitcoin's liquidity has surpassed gold, becoming the new 'corporate reserve standard'.
As mainstream media remains indifferent and retail investors panic over non-farm data, savvy capital is seizing the opportunity to lay out its strategy. From the CME gap being filled to whales completing their turnover, from rising interest rate cut expectations to the corporate hoarding of coins, the technical and fundamental aspects have formed an upward resonance. If historical patterns repeat, the current fluctuation may be the last shakeout before Bitcoin hits $150,000.