**HUMA Market Analysis**
$HUMA
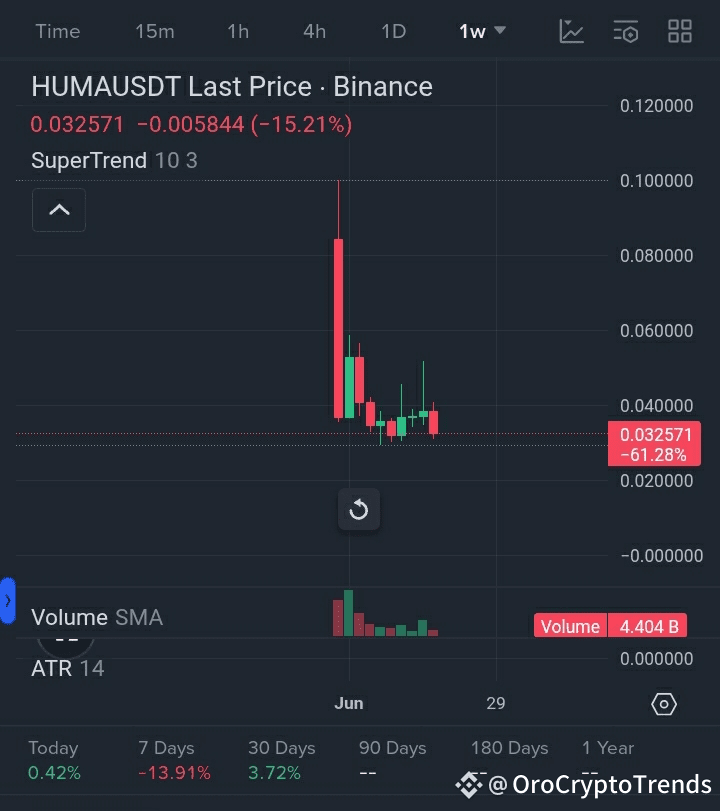 **Overview of HUMAUSDT Perpetual Contract**
**Current Performance:**
- Change: +3.01%
**🔍 Market Snapshot:**
- Current Price: $0.03267
- RSI (14): 39.57 – approaching oversold territory
- MACD: Neutral with a flat line convergence – lacking strong trend conviction
- 30-Day Volatility: 9.01%
- Fear & Greed Index: 53 (Neutral)
- Sentiment: Bearish – 3 indicators bullish vs. 6 indicators bearish
Huma Finance (HUMA) is currently trading within a narrow consolidation range with weakening momentum. This is evident as the RSI dips below 40 and the MACD flattens. Although there is short-term indecision, long-term patterns suggest a potential accumulation setup.
**📅 Short-Term Forecast (5 Days to 1 Year)**
**🔢 5-Day Forecast (August 4–8, 2025):**
| Date | Prediction | Daily Change | Potential ROI (Short) |
|-----------|------------|--------------|------------------------|
| Aug 04 | $0.03267 | 0.00% | – |
| Aug 05 | $0.02932 | -10.25% | 10.25% |
| Aug 06 | $0.026957 | -8.08% | 17.49% |
| Aug 07 | $0.025782 | -4.36% | 21.08% |
| Aug 08 | $0.025121 | -2.56% | 23.11% |
> **Volatility Indicator:** Anticipated steep short-term decline due to high selling pressure. Increased likelihood of a reversal or local bounce near $0.025.
**🗓️ August–December 2025 Monthly Outlook:**
| Month | Min Price | Avg Price | Max Price | Potential ROI |
|-------|-----------|-----------|-----------|---------------------|
| Aug | $0.022861 | $0.025961 | $0.03267 | 30.03% (Short) |
| Sep | $0.024815 | $0.025677 | $0.026536 | 18.78% |
| Oct | $0.024436 | $0.025255 | $0.026335 | 19.39% |
| Nov | $0.022489 | $0.023837 | $0.024919 | 23.73% |
| Dec | $0.023777 | $0.024358 | $0.024874 | 23.86% |
> **Short-Term Strategy:** Bearish momentum is expected to continue through Q4, offering opportunities for high-risk shorts or long-term accumulation near $0.022–$0.024.
**📆 1-Year Forecast (To August 2026):**
- Predicted Average Price: $0.048937
- Maximum Price: $0.089307
- 1-Year ROI (Hold): Up to 173.36%
- 1-Year ROI (Short-Term Entry Now): 49.75%–173.36%
**📈 Multi-Year Forecast Summary (2026–2030):**
| Year | Min Price | Avg Price | Max Price | Potential ROI |
|------|-----------|-----------|-----------|---------------------|
| 2026 | $0.024617 | $0.048937 | $0.089307 | 173.36% |
| 2027 | $0.030867 | $0.04403 | $0.059945 | 83.48% |
| 2028 | $0.031883 | $0.036276 | $0.047364 | 44.98% |
| 2029 | $0.041738 | $0.054953 | $0.080978 | 147.86% |
| 2030 | $0.068566 | $0.087623 | $0.137702 | 321.49% |
> **Bullish Outlier Months:**
- May 2026: $0.089307 (Peak breakout period)
- Nov 2029: $0.080978
- Feb 2030: $0.137702 (Forecasted cycle top)
**🚀 Bullish Scenario:**
- **Breakout Trigger:** Sustained price action above $0.034056 (R2) with increasing volume and RSI > 55.
- **Macro Catalysts:**
- Integration into major DeFi ecosystems
- Institutional adoption or a Binance listing boost
- Bitcoin bull cycle (Q4 2025 – Q2 2026)
- **Accumulation Zone:** $0.022 – $0.026
- **10x ROI Potential:** By the end of 2030, if the maximum projection of $0.137702 is realised.
**🧨 Bearish Scenario:**
- **Breakdown Risk:** Close below $0.022489 (S3) with decreasing volume.
- **Pattern Risks:**
- Descending triangle or continuation of head-and-shoulders pattern
- Consistent rejection at R1–R2 levels
- **Catalysts for Decline:**
- Regulatory crackdowns on DeFi platforms
- Whale dumping activity
- Macro headwinds (e.g., interest rate increases)
**🧠 Technical Analysis Overview**
**📈 Oscillators:**
| Indicator | Value | Signal |
|-------------------|----------|--------------|
| RSI (14) | 39.57 | Neutral/Oversold |
| CCI (20) | -66.67 | Neutral |
| MACD | 0.00 | Neutral |
| Stochastic Fast | 4.98 | Buy |
| Momentum (10) | -0.01 | Neutral |
| Ultimate Oscillator | 30.27 | Neutral |
**🔁 Moving Averages (Daily):**
| SMA/EMA | Value | Signal |
|---------|-----------|----------|
| SMA 3 | $0.047355 | SELL |
| EMA 3 | $0.037055 | SELL |
| VWMA (10) | 0.04 | SELL |
| Hull MA (9) | 0.03 | BUY |
> Momentum remains low, with most moving averages indicating weakness. However, short-term traders should monitor the Hull Moving Average and Stochastic for early reversal signals.
**📍 Pivot Levels:**
| Type | Level |
|--------|------------|
| P1 | $0.031967 |
| S1 | $0.030881 |
| S2 | $0.029879 |
| S3 | $0.028793 |
| R1 | $0.03297 |
| R2 | $0.034056 |
| R3 | $0.035058 |
**💬 Sentiment & Correlation Insights:**
- **Sentiment Split:** 67% Bearish, 33% Bullish
- **Social Trend:** Low engagement with declining mentions
- **Whale Activity:** No significant accumulation on-chain recently
- **Macro Influences:**
- Rising Bitcoin dominance, with altcoins lagging
- Growth in stable DeFi usage may indirectly benefit HUMA
**Correlation:** Currently low correlation with major altcoins.
**📘 HUMA Investor Playbook**
**📍 Entry Zones:**
- Accumulate between $0.022–$0.026 for long-term investment.
- Monitor for volume spikes near $0.030–$0.032 for confirmation.
**📈 Long-Term Strategy:**
- Dollar-cost average (DCA) throughout Q3–Q4 2025, aiming for mid-2026 peak for partial exits.
- Re-enter upon breakdown and base formations near $0.025.
**🔒 Risk Management:**
- Set a stop-loss below $0.0218 to mitigate downside risk.
- Avoid over-leveraging; utilise less than 2x leverage on any breakout strategy.
**📊 DCA Plan (Example):**
- August: $0.025 @ 25%
- September: $0.026 @ 25%
- November: $0.023 @ 25%
- January 2026: $0.027 @ 25%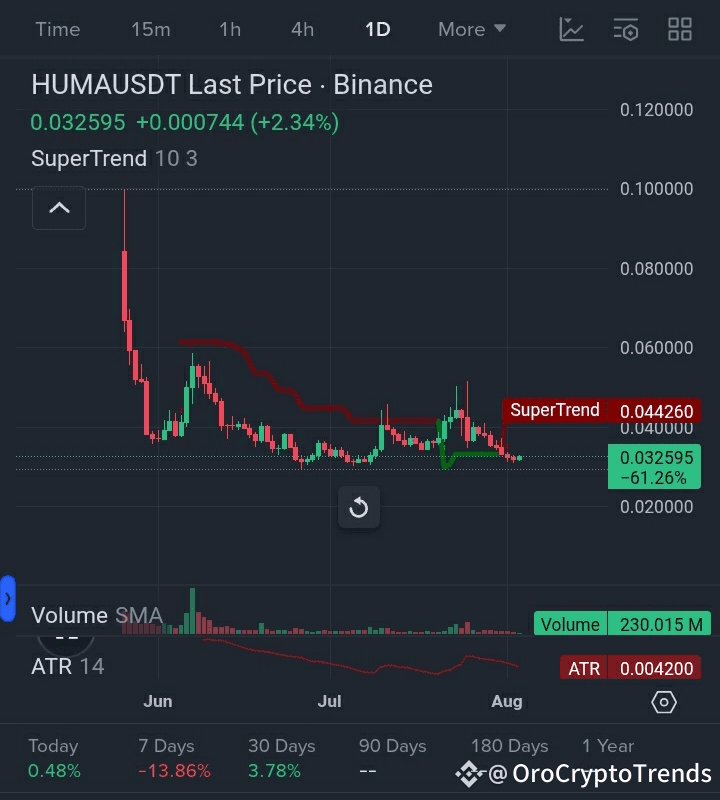
**❗️Disclaimer:**
This report is intended for educational purposes only and does not constitute financial advice or a recommendation to buy, sell, or hold any asset. Always conduct your own research (DYOR) and consult with a licensed financial advisor before making investment decisions. Cryptocurrencies are high-risk investments and are extremely volatile.
#Write2Earn #HUMAFINANCE #HUMA @Huma Finance 🟣
