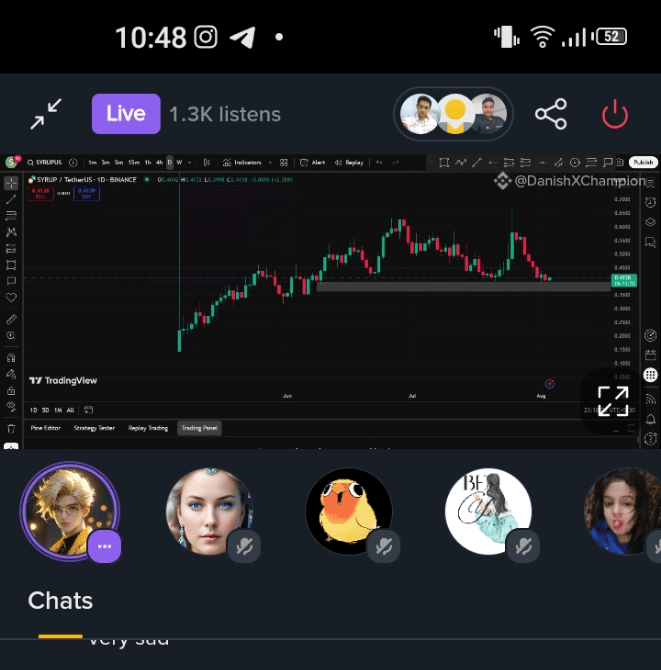
Caught an amazing live session by @DanishChampionX last night 🔥
Topic: Support, Resistance & Chart Analysis 📊
Dropping some quick treasure tips from it soon 💎📈
Stay tuned🎯 "— When you're staring at the chart like it's a puzzle 🧩
👨🎓 Usman (Beginner Trader):
"Bro @DanishChampionX, I'm so confused 😩
Which time frame should I use? There’s 1m, 15m, 1H, 4H, 1D... it’s like Netflix – too many options! 🎬📊"
🧠 DanishChampionX (Senior Trader):
" Relax Usman! I got you! Let me explain in simple steps:👇"
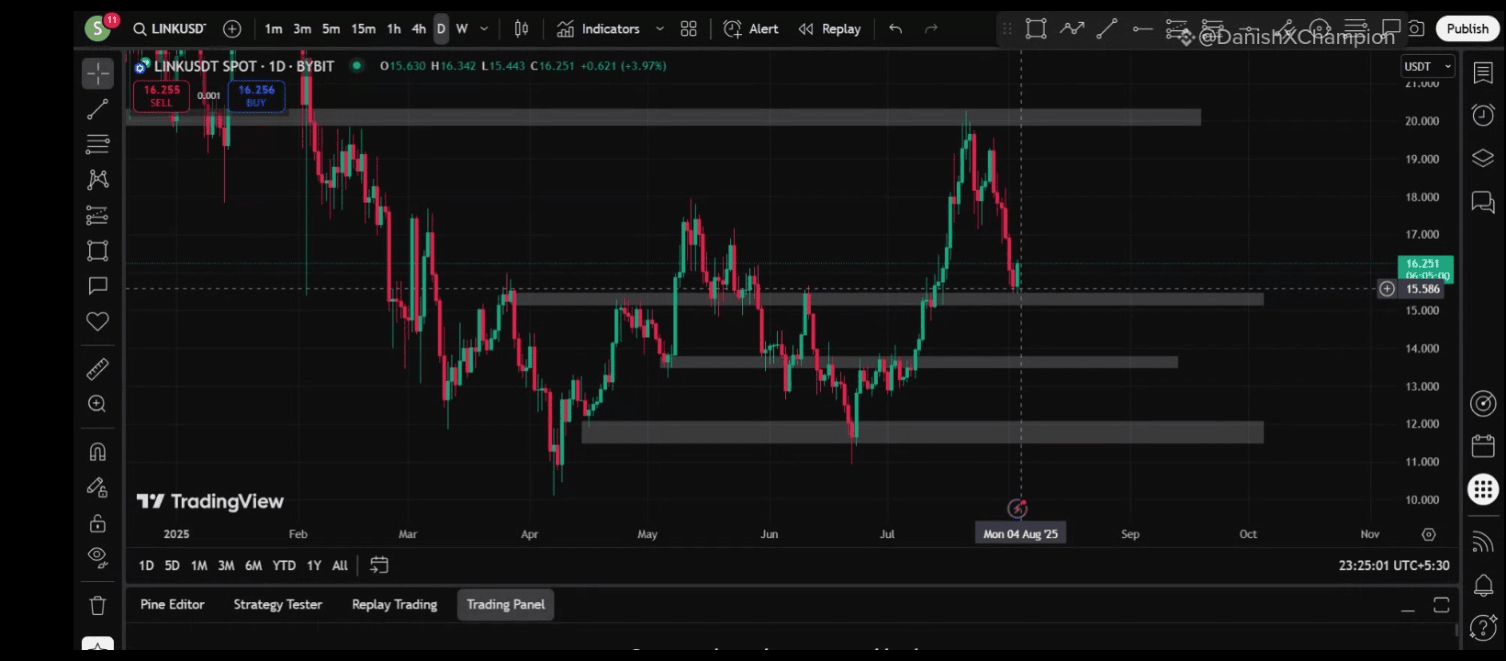
🟢 1. What Are Time Frames?
A time frame shows how long each candle/bar represents.
For example:
1M = 1-minute candle
15M = 15-minute candle
1H = 1-hour candle
1D = 1-day candle
1W = 1-week candle
🟡 2. For Short Trades (Scalping or Day Trading):
Use 1M, 5M, or 15M charts
They show quick moves – great for fast in & out trades
Check 1H for trend confirmation
📌 Example: Entry on 5M after checking trend on 1H
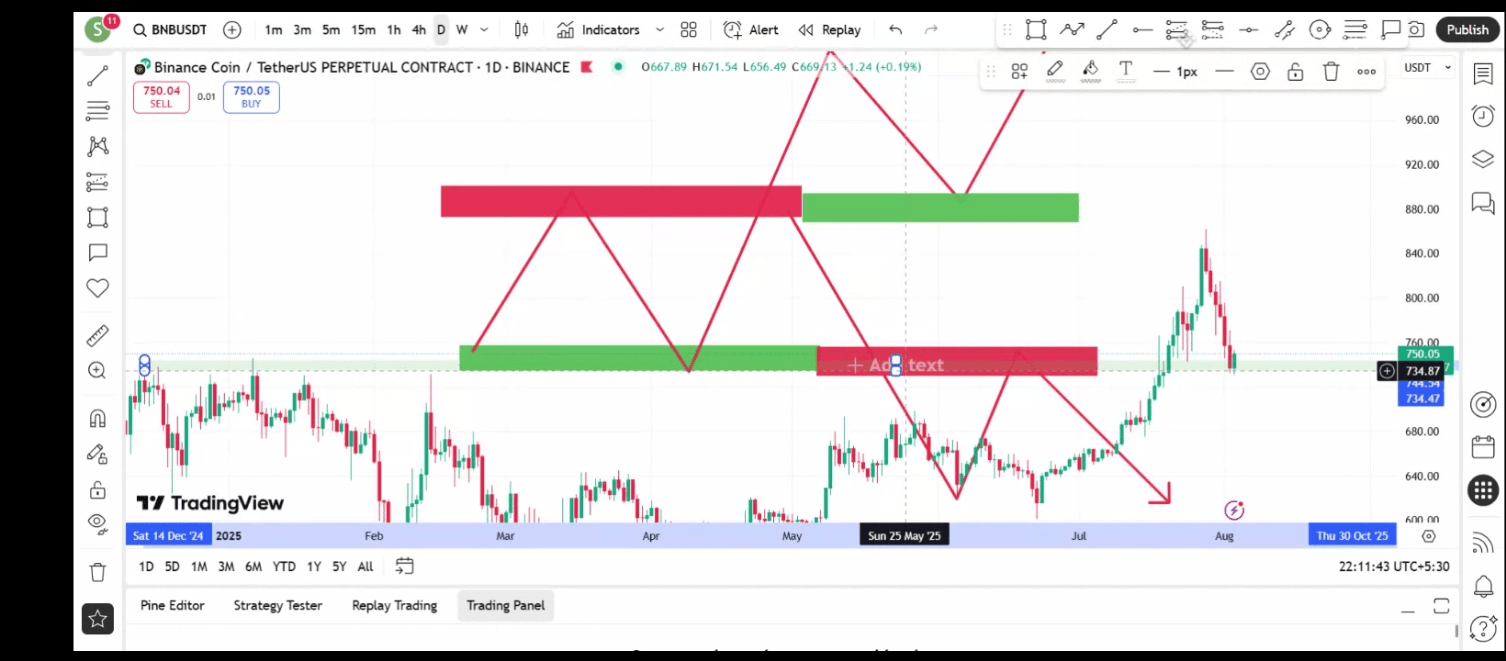
🔵 3. For Long Trades (Swing or Monthly Positions):
Use 1D, 1W, or even 1M (Monthly)
Best for holding trades for days, weeks, or months
📌 Example: Buy on support seen on the 1D chart, hold for weeks
🔁 4. Bonus Tip: Multi-Time Frame = Super Power
🧩 Check higher time frame for trend
🎯 Use lower time frame for entry & exit
> “Zoom out to see where you’re going. Zoom in to start driving!” 🚗
🧠 DanishChampionX:
"Time frames = your trading map 🗺️
Choose your journey, choose your time frame 💼"
🤯 Usman:
"OHHH! So short = small time frames, long = big time frames.
I get it now! , Danish!"Bro
🔥 DanishChampionX:
"Now you're learning like a real trader! See you in next live session! 💻📈
#LearnWithDanishChamoionX #TimeframeGuide #SUI🔥