🚀 XRP/USDT: A Potential Trade Opportunity Amidst Market Fluctuations
The market for XRP has recently shown strong movement, and its recent trading chart indicates a potential trade opportunity for those keeping an eye on the XRP/USDT pair.
Current Price Overview:
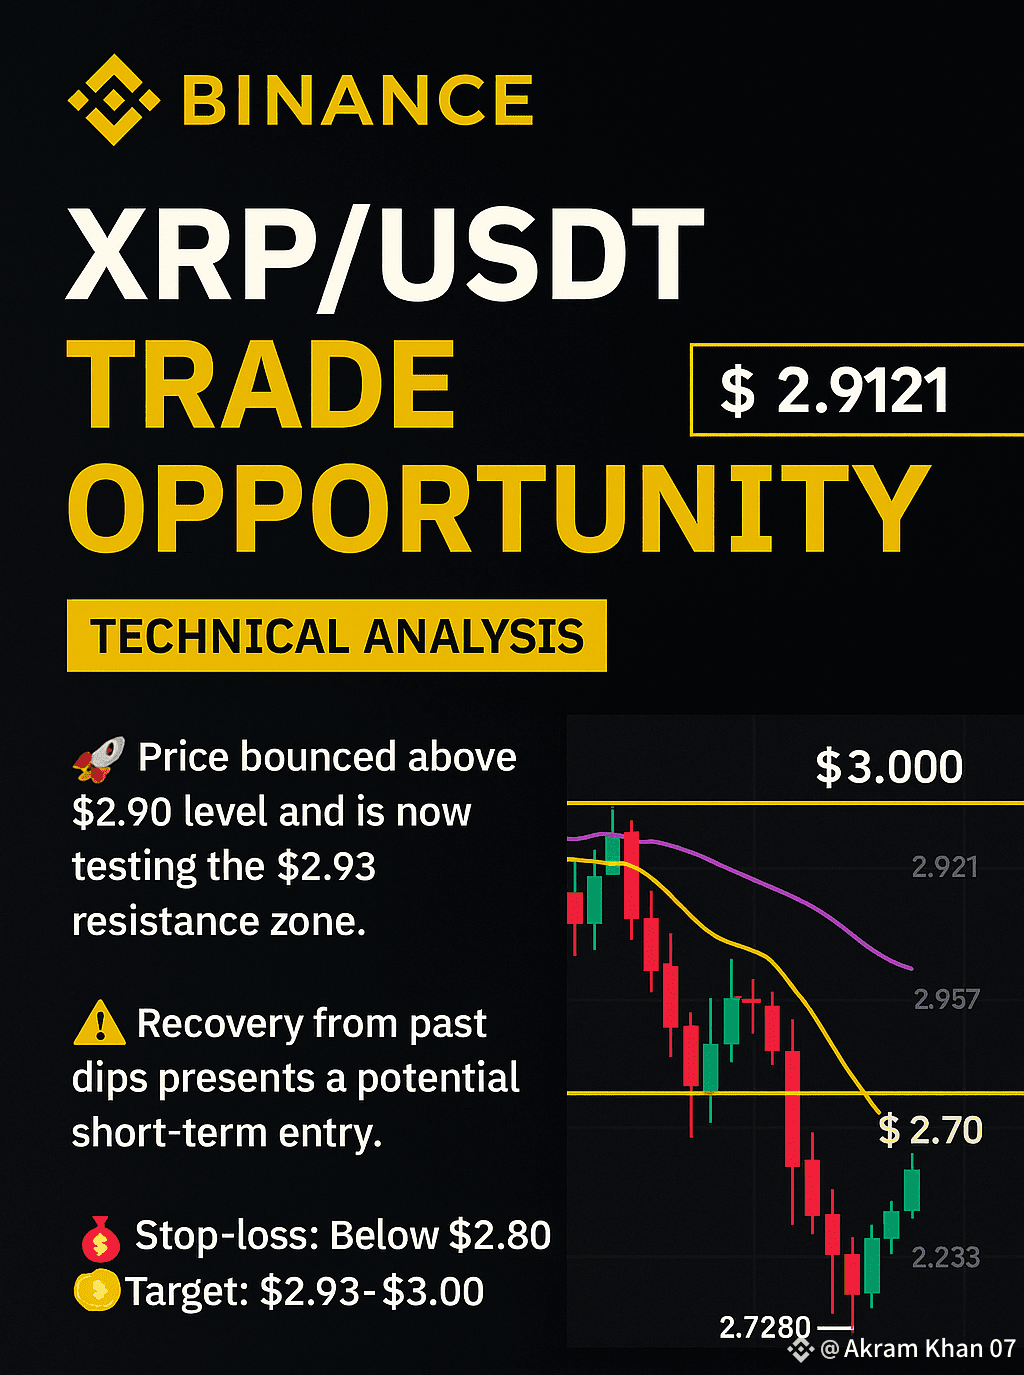
💰 Price: $2.9121
📈 24H High: $2.9300
📉 24H Low: $2.7280
📊 Price Change: +4.60%
XRP has been trading above the $2.90 level, showing a positive change of 4.60%. The price has recently bounced from the low of $2.7280 and is currently aiming towards higher levels. The green candlestick pattern indicates bullish sentiment.
Key Indicators:
1️⃣ Moving Averages:
MA(7): 2.8466
MA(25): 2.9775
MA(99): 3.2153
The short-term MA(7) is showing positive momentum, while the long-term MAs suggest bullish continuation.
2️⃣ Volume:
Volume is increasing during price rises — showing strong buying pressure that could continue pushing prices higher.
Potential Market Scenario:
XRP is sitting just above $2.90, looking to test the $2.93 level. Recovery from the recent dips could present a buying opportunity for short-term traders.
⚠️ Watch broader market sentiment, as crypto volatility can trigger sudden swings.
Risk & Reward:
🎯 Upside target: $2.93 – $3.00
⚠️ Stop-loss zone: Below $2.80
Conclusion:
If you’re looking for a short-term profit, XRP/USDT looks promising. Monitor the $2.93 and $2.70 levels closely. Always DYOR and manage risk — volatility can be both an opportunity and a challenge.
Disclaimer: Includes third-party opinions. No financial advice. May include sponsored content. See T&Cs.