$XRP XRP’s recent decline has unsettled parts of the crypto community, especially after the asset reached a peak of $3.65 in July. Since then, the bullish momentum has cooled considerably. The asset is trading at $2.82, a 5.43% drop from yesterday, having fallen below the psychologically significant $3 support level recently.
Despite the sharp downturn, not all analysts are signaling alarm. In a post on X, well-known trader and market analyst CryptoBull shared a 4-hour chart suggesting that XRP may be approaching the tail end of its current corrective move. According to CryptoBull, “this XRP dip is almost over.”
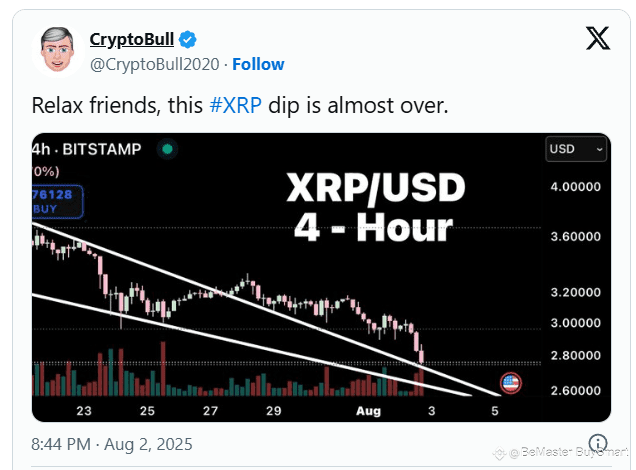
A Falling Wedge Forms on the 4-Hour Chart
The chart, which covers price action from mid-July to early August, displays a falling wedge formation, a classic technical pattern that often precedes a bullish breakout.
The narrowing price action is marked by descending resistance and support lines converging toward the current price. The pattern is visible across multiple lower highs and lower lows, with the recent price action testing the wedge’s lower boundary below $2.8.
This setup indicates weakening selling pressure, even as prices decline. Volume analysis within the chart also shows a tapering pattern, consistent with a potential exhaustion of downward momentum.
💥XRP Support Levels Suggest Bearish Exhaustion
Although XRP has seen a notable decline from its recent peak, the current chart positioning implies it may be nearing a technical support level. The downward sloping wedge has not yet broken to the upside, but such patterns often act as precursors to bullish reversals once a breakout occurs with conviction and volume.
Still, the absence of a confirmed breakout means traders should remain cautious. If XRP fails to hold the lower trendline around $2.7, the price could continue to slide, testing deeper levels of support. On the other hand, if buying pressure increases and XRP breaks above the upper resistance line currently just below $3, it may signal a return of upward momentum.
👉🚀👉Is An XRP Reversal Coming?
CryptoBull’s chart interpretation comes at a moment of uncertainty for XRP holders. While the recent price action has been bearish, the structure shown on the 4-hour chart provides a technical basis for optimism.
Other analysts have expressed confidence that XRP’s recovery is imminent, and the next few sessions could prove critical in confirming whether this dip is indeed near its end or if further downside awaits.
🚀🚀🚀 FOLLOW BE_MASTER BUY_SMART 💰💰💰
Appreciate the work. 😍 Thank You. 👍 FOLLOW BeMaster BuySmart 🚀 TO FIND OUT MORE $$$$$ 🤩 BE MASTER BUY SMART 💰🤩
🚀🚀🚀 NOT JUST LIKE BUT, CLICK FOLLOW BE MASTER BUY SMART - Thank You.
