🎯 Objective: Understand what chart patterns are, how they form, and why they offer an edge in trading.
🔹 Definition:
Chart patterns are repetitive price structures formed by the market’s psychology. They reflect the ongoing battle between buyers (bulls) and sellers (bears), signaling whether the current trend will continue or reverse.
🔹 Three Core Types of Patterns:
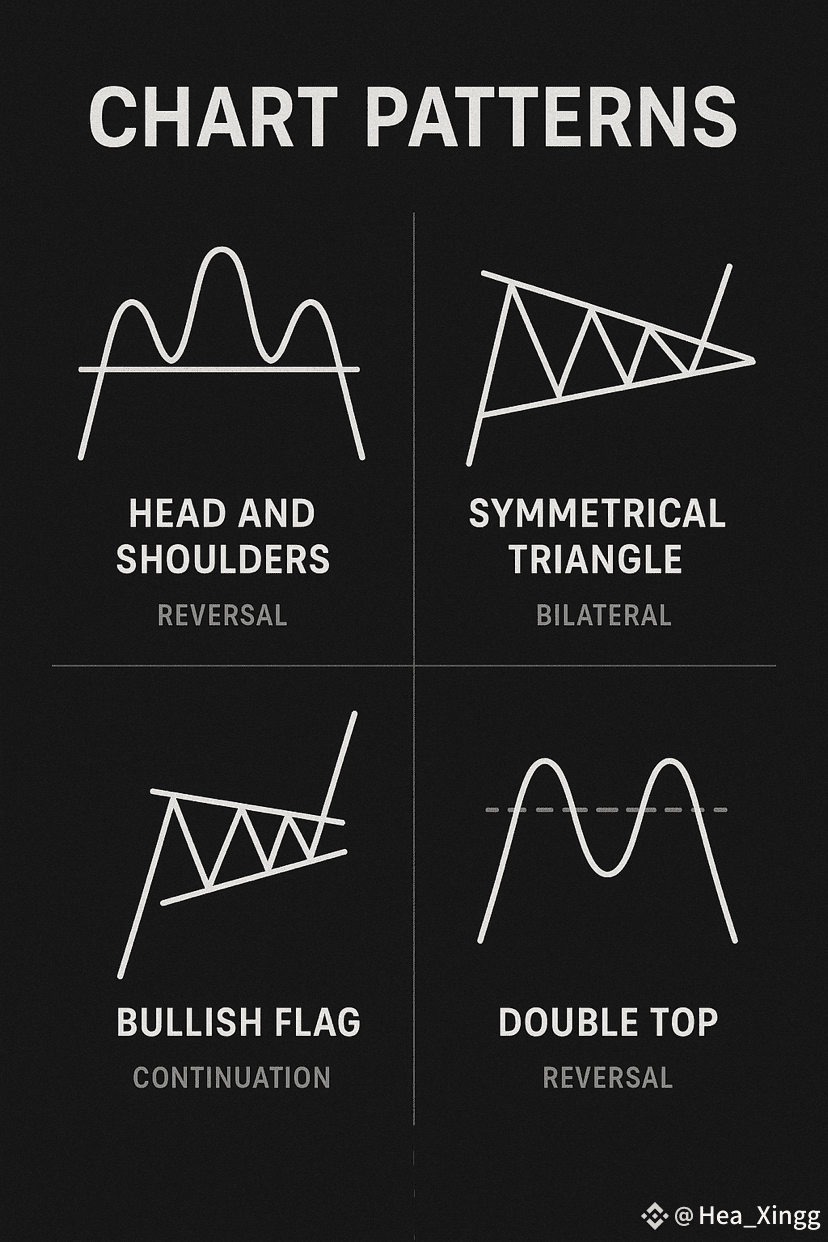
Reversal Patterns
➤ Indicate a potential shift in trend direction
➤ Example: Head & Shoulders, Double Top/BottomContinuation Patterns
➤ Suggest the prevailing trend will resume after a pause
➤ Example: Flags, Pennants, TrianglesBilateral Patterns
➤ Breakout may occur in either direction
➤ Example: Symmetrical Triangle, Rectangle
🔹 Why Learn Chart Patterns?
✅ Improve entry/exit precision
✅ Identify key breakout or breakdown zones
✅ Understand where retail traders often get trapped
✅ Combine with indicators (e.g., RSI, Volume, Moving Averages) for confirmation
✅ Develop an eye for market structure over time
🧠 “Patterns don’t predict, they prepare.”