The candlesticks in the crypto market are like an ECG; the violent rises and falls are its heartbeat, while the true winners can always hear the pulse of the trend amidst the chaos.
ETH's current trend is like the old tricycle at my second uncle's house—
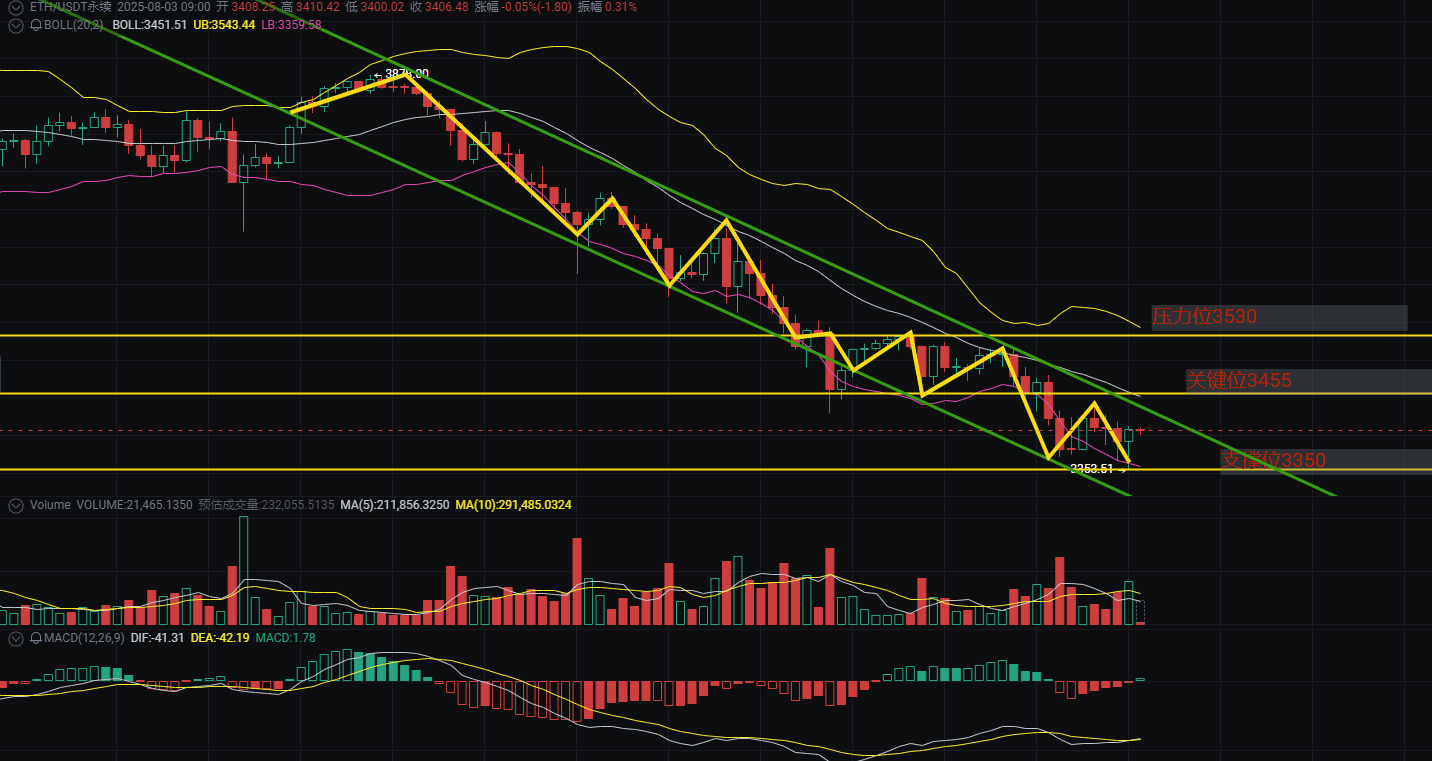
In the morning, I struggled to crawl a few steps, in the afternoon I fell into a ditch with a bang, and at midnight I'm leaking oil and lying down! The 3400 position is even more critical, swaying on the lower Bollinger Band like it's hanging off a cliff.
Look at this 1-hour candlestick:
The Bollinger Bands are opening downwards, like a loose belt, indicating that the bears are still flaunting themselves
The two lines of the MACD are lying dead under the water, like an ICU patient, waiting for the 'golden cross' as a shot of adrenaline
The most outrageous part is the trading volume—it's falling without any increase in volume, clearly a dull knife cutting flesh!
Yesterday a fan asked me: "Teacher! Is 3400 the solid bottom?" I directly threw a chart at him—look at how we do it

Today's life-and-death line
🔥 3455: Only a breakthrough counts as catching a breath; otherwise, it's still fish on the chopping block
💀 3350: A significant drop directly leads to 3200; once the waterfall gate opens, it’s a massacre
The market is always in a cycle; after a crash, is it an opportunity or a bottomless pit? In the next issue, I will reveal the three key characteristics of the major buying signals—like when 'big players' suddenly increase their volume, it is often a precursor to the big shots taking action. Follow me to avoid pitfalls and eat meat!
(Divine strategy tip: Trading is like surfing; when the waves are too big, crouch and watch; stand up when the waves are steady!)#ETH跌破3400