The current structure forming on Solana ($SOL) is catching the eyes of serious traders for good reason. Across multiple timeframes, this market is laying down one of the cleanest bullish continuation patterns, a textbook cup and handle. The daily chart already suggests a healthy consolidation phase, but it's the weekly formation that demands deeper attention. A curved cup followed by a forming handle is playing out right above the $140–$150 region. This zone isn’t weakness-it’s where patient buyers reload before the next explosive move.
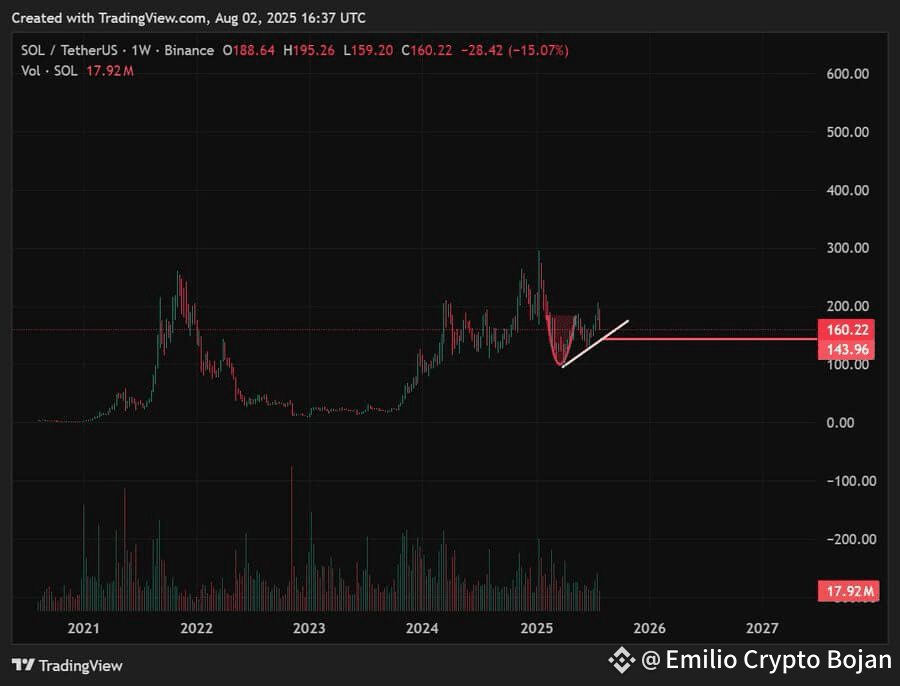
Source: TradingView
On the monthly chart, the setup becomes even louder. A massive rounded bottom stretching back over a year has built solid structural support beneath the $105 level. That range is now long gone, and price is hovering just beneath key resistance. The market is coiling tightly, with declining sell pressure and rising accumulation. Momentum is building under the surface, and once the handle resolves, the measured move targets the $700 zone with confidence.
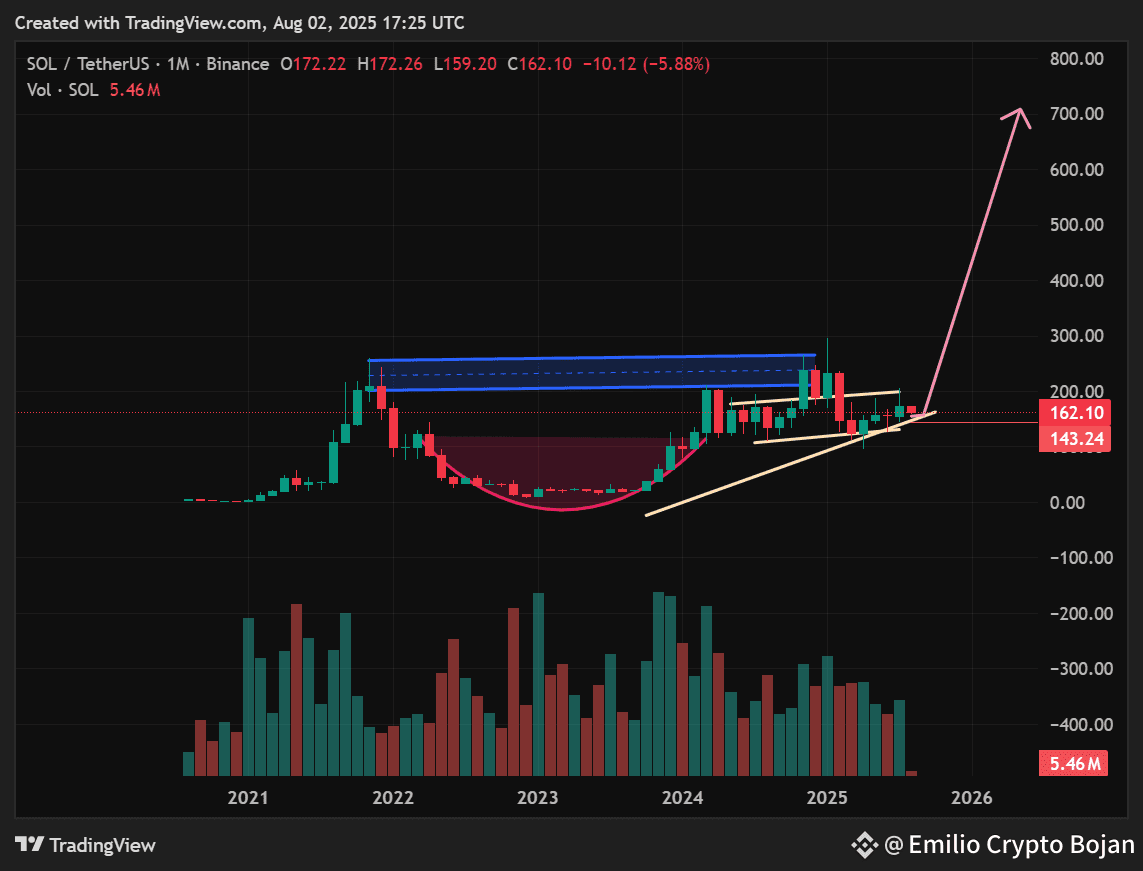
Source: TradingView
Adding more fire to the bullish case is Nasdaq’s latest ETF eligibility filing. In this regulatory blueprint, only five digital assets are named as ETF-ready, and Solana is on the list. That places $SOL in the same regulatory league as Bitcoin and Ethereum in terms of futures and ETF accessibility. The document highlights Volatility Shares’ Solana ETF as already exceeding the 40% exposure threshold, meaning institutional products are not only possible, they’re already in motion.
When a powerful technical structure aligns with major regulatory green lights, the outcome is rarely subtle. Solana is sending a clear message across all timeframes: zoom in, see the handle, and know what comes next. The dip toward $145 isn’t a breakdown, it’s fuel. Let it play out. Let it reload. Because if this handle completes, $700 won’t be just a target—it’ll be the roadmap. STAY ALERT.