How to Use Chart Patterns to Maximize Profit in Trading
Whether you're into crypto, stocks, or forex, trading success comes down to three things: timing, analysis, and discipline. One of the most effective tools to master? Chart pattern recognition.
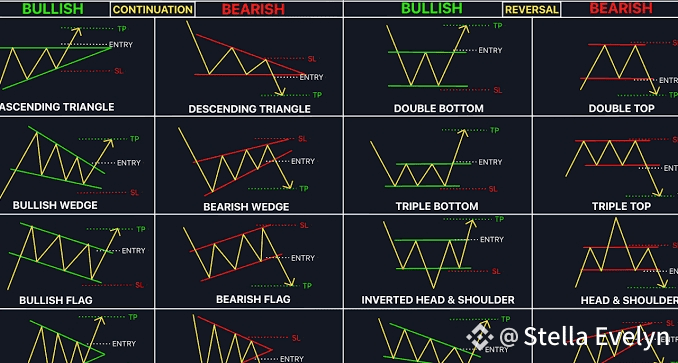
The chart you're referencing outlines 16 powerful patterns, grouped into Bullish, Bearish, and Reversal categories. Understanding these can seriously elevate your win rate and help limit your losses.
---
🔍 What Are Chart Patterns?
Chart patterns are visual reflections of market psychology — showing how buyers and sellers interact at key levels. These formations repeat over time and can help traders anticipate price moves.
---
🚀 Bullish Patterns – Time to Buy the Breakout
Bullish patterns suggest potential upward movement. Traders usually look to go long once a breakout is confirmed.
Examples:
Ascending Triangle
Falling Wedge
Bullish Flag
Inverted Head & Shoulders
Double/Triple Bottom
Bullish Wedge
Symmetrical Triangle (Bullish bias)
Basic Strategy:
Entry: On breakout above resistance
Stop-Loss: Below recent swing low
Take-Profit: Use prior high or pattern projection
---
📉 Bearish Patterns – Get Ready to Short
Bearish patterns point to a potential price drop. Traders look to enter short positions after a confirmed breakdown.
Examples:
Descending Triangle
Rising Wedge
Bearish Flag
Head & Shoulders
Double/Triple Top
Bearish Wedge
Symmetrical Triangle (Bearish bias)
Basic Strategy:
Entry: On breakdown below support
Stop-Loss: Above recent swing high
Take-Profit: Use prior low or measured move
---
♻️ Reversal Patterns – Spot the Trend Shift Early
Reversal patterns signal when the market is likely to change direction — either from up to down, or vice versa. Catching these early gives you a front-row seat to a new trend.
Key Examples:
Double Bottom → Bullish Reversal
Double Top → Bearish Reversal
Inverted Head & Shoulders → Bullish Reversal
Head & Shoulders → Bearish Reversal
---
📈 7 Pro Tips to Maximize Profits with Chart Patterns
1. Always Wait for Confirmation
Don’t jump in too early — confirm breakouts/breakdowns with volume and price action.
2. Plan Entry, Stop-Loss & Take-Profit
Use chart guidance:
✅ Entry after breakout
❌ SL at red dotted line
🎯 TP at green dotted line
3. Use a Risk-Reward Ratio (RRR)
Only take trades with at least 1:2 RRR. Risk $10 to potentially gain $20.
4. Combine Patterns with Indicators
Add volume spikes, RSI, MACD, or moving averages for added confirmation.
5. Backtest Before You Go Live
Practice patterns on historical data or in a demo account to build confidence.
6. Focus on Higher Timeframes
Patterns on the 1H, 4H, or Daily charts are more reliable than those on lower timeframes like 5M or 15M.
7. Avoid Overtrading
Only trade high-probability setups. Discipline beats hype every time.
---
💡 Final Thoughts
Chart patterns give you a technical edge. When used with sound strategy and proper risk management, they help you:
✅ Enter smarter trades
✅ Avoid emotional decisions
✅ Lock in bigger profits
✅ Cut down on unnecessary losses
Smart traders don’t chase the market. They wait, watch, plan — and then act with precision.
---
#TradingTips #ChartPattern #CryptoTrading #Binance #ForexStrategy