What frustrates people in the cryptocurrency market the most is not market volatility, but that you can never predict what the major players are doing — clearly seeing good news yet experiencing a plummet, thinking you’ve hit the bottom only to see new lows. In fact, the actions of major players are already hidden in on-chain data: sudden drops in exchange reserves, subtle changes in whale holdings, and the distribution structure of chip costs; these three indicators act like a 'CT scan' of the market, helping you avoid 80% of traps and seize real opportunities.
1. Exchange Reserve Volume: A 'barometer' for collapse warnings and bull market signals.
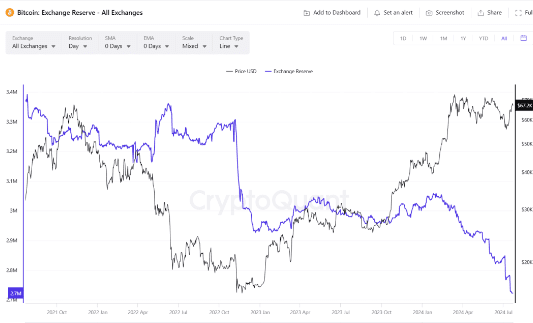
The BTC reserves of major global exchanges (such as Binance, Bitfinex, etc.) act as a 'real-time ECG' for capital flow. Understanding this data can help you avoid JPEX-style collapses and seize opportunities for ETF entries.
1. Technical Significance: Changes in Reserve Volume = Capital Attitude Votes.
Reserve volume plummets: this could be panic withdrawals (risk) or institutional accumulation (opportunity), depending on the 'speed' and 'accompanying signals'.
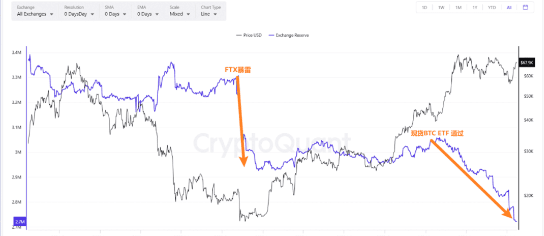
Before the FTX collapse in 2022, reserve volume decreased by 120,000 BTC within 3 days, accompanied by a large number of abnormal USDT transfers — this is a typical risk signal.
After the January 2024 spot ETF approval, reserves decrease by 50,000 BTC monthly, but the market cap of stablecoins increases simultaneously — this is a positive signal for institutional accumulation.
The 'withdrawal wave' during bear markets and black swan events.
When the market experiences a trust crisis (like the FTX collapse in 2022), investors panic and withdraw funds to personal wallets, leading to a sharp decline in exchange reserves. This 'voting with feet' behavior directly reflects the market's confidence collapse in centralized exchanges.
Bull Market Bull-Bear Game Signals
In a bull market, an increase in reserve volume means more BTC flows into exchanges, leading to potential selling pressure; conversely, a decrease in reserves could indicate continuous accumulation by institutions or retail investors — for instance, after the approval of the spot BTC ETF in January 2024, institutions like BlackRock and Fidelity made large-scale purchases, driving continuous declines in exchange reserves.
Key Point: A decrease in reserve volume is not necessarily a good sign; the key is the reason — panic withdrawals are a risk signal, while proactive accumulation is a long-term positive.
Current BTC reserve volume trend and analysis of the JPEX case.
Currently, the overall BTC reserve volume across global exchanges is on a decreasing trend, with the core flow being driven by demand for U.S. stock spot ETF allocations.
Taking the recently collapsed JPEX in September 2023 as an example, when users revealed on Twitter about 'withdrawal delays', its reserves sharply declined in a short period, becoming a precursor to the platform's collapse.
This reminds us: abnormal fluctuations in the reserves of individual exchanges may be a 'red flag' for risk warnings.
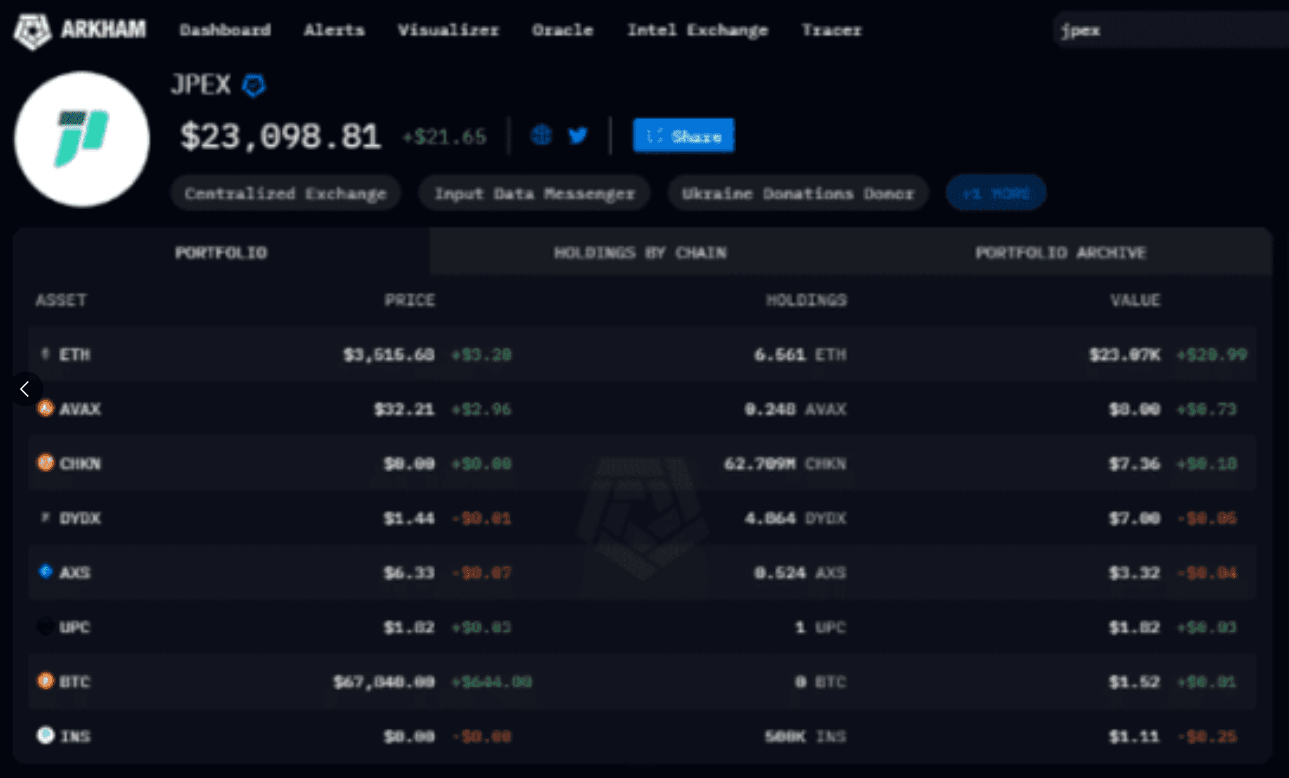
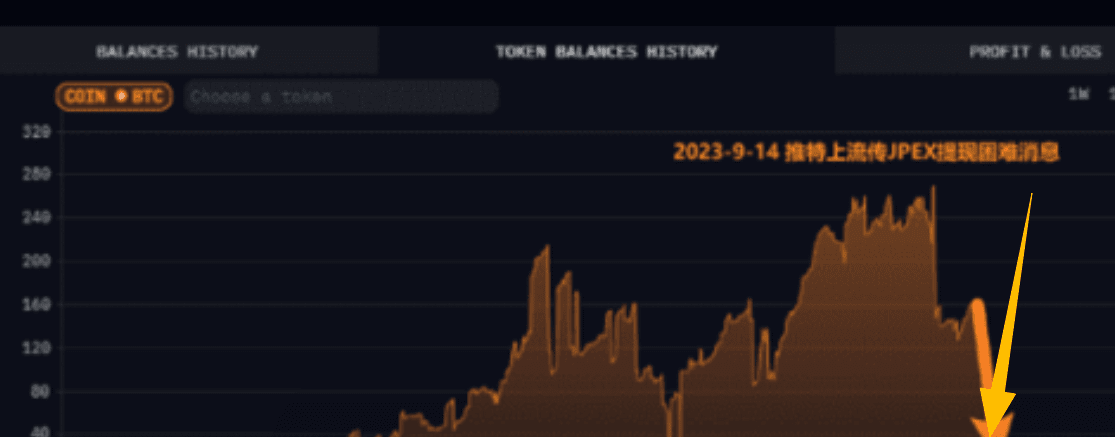
This is JPEX, which collapsed last year; around September, many people reported issues with withdrawals on Twitter, and you can see that the BTC reserves of this exchange dropped significantly during that time.
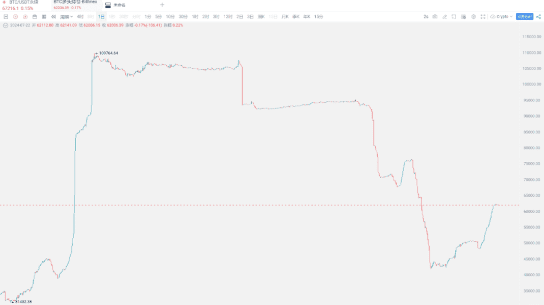
2. Bitfinex Long Positions: A 'compass' for whale movements.
1. Why has Bitfinex become a gathering place for whales?
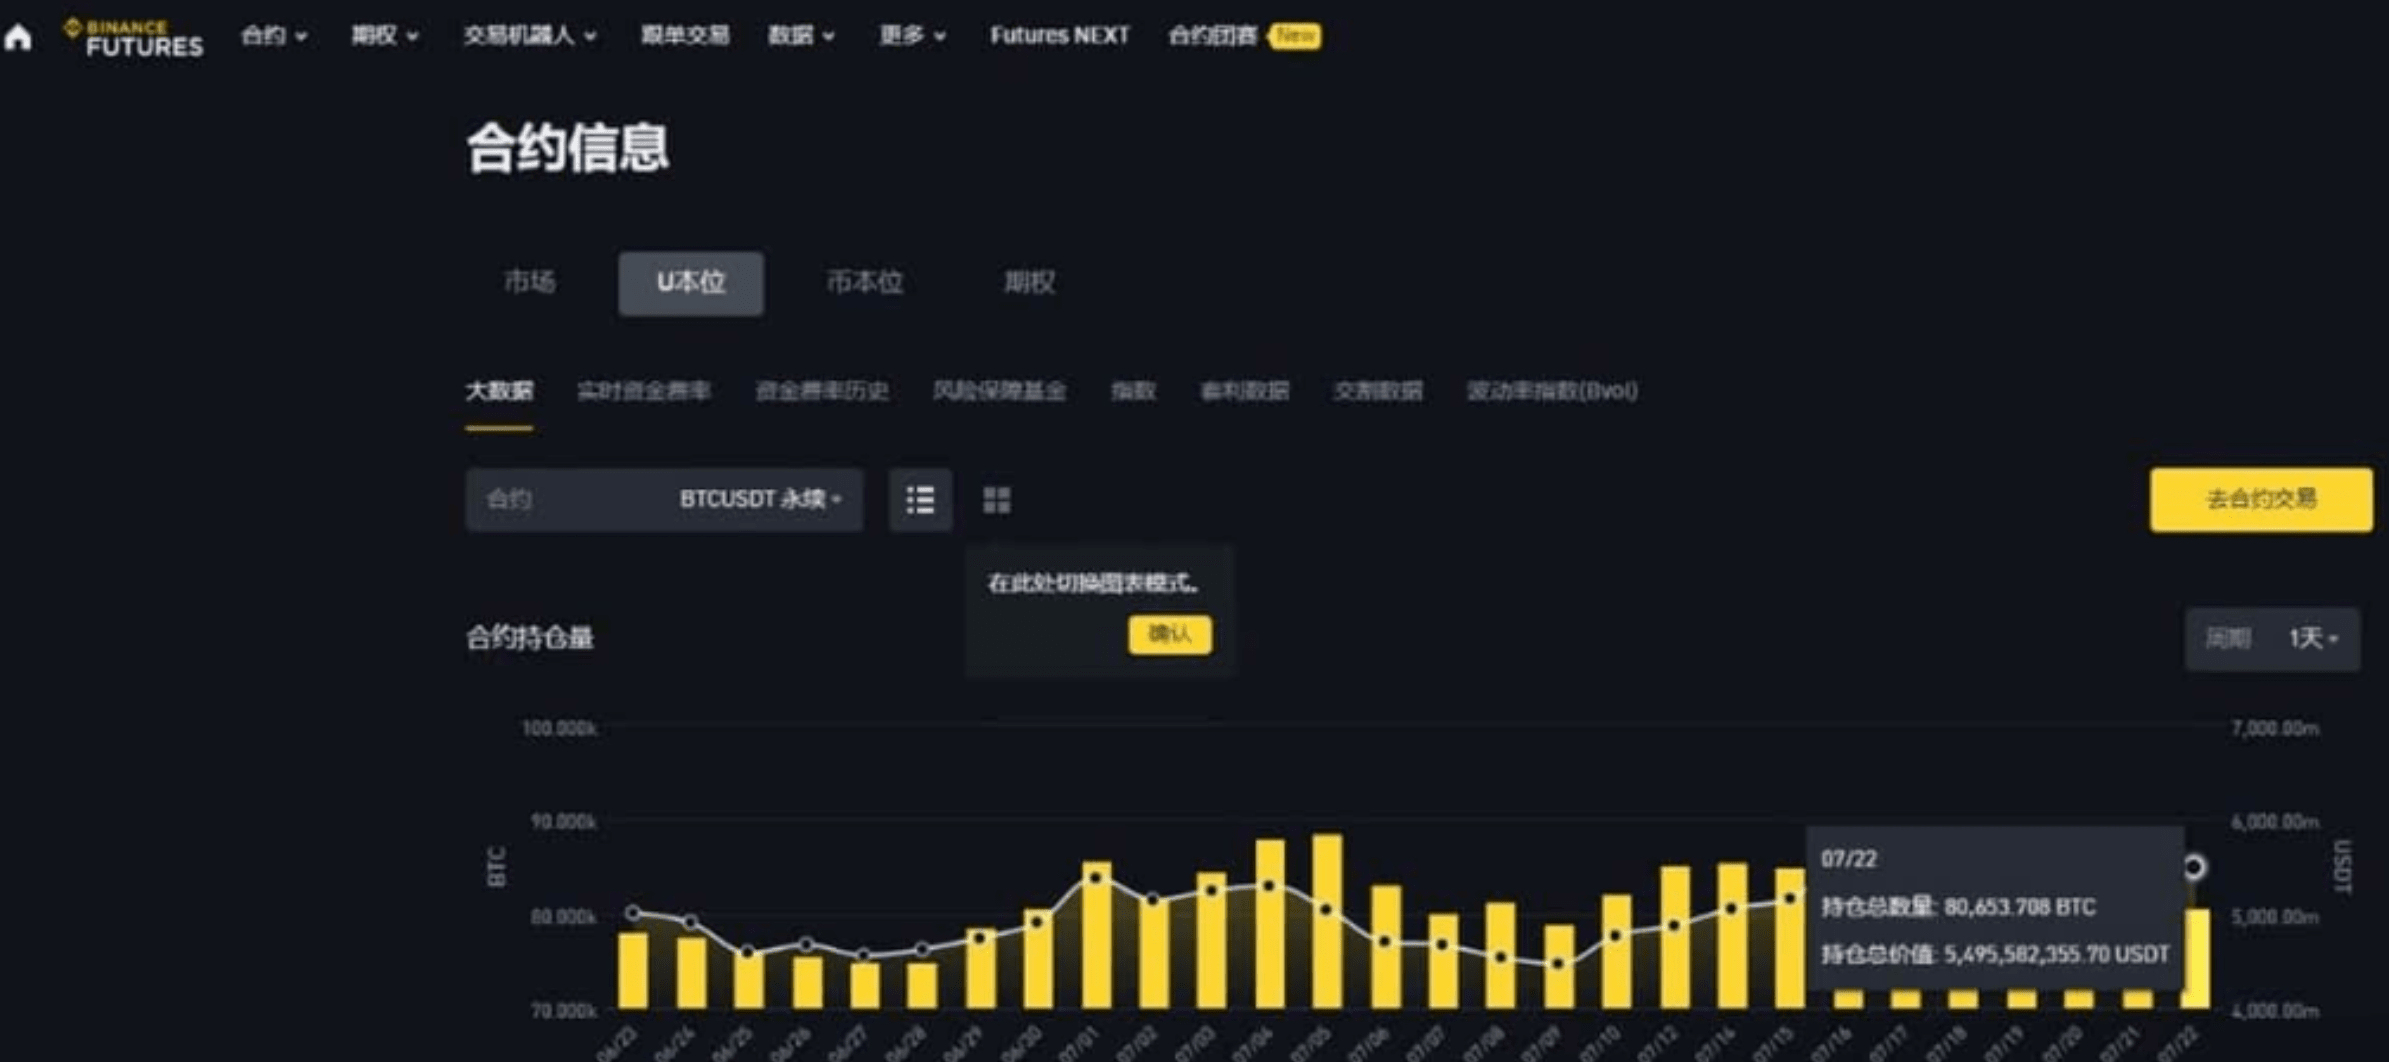
As a veteran derivatives exchange, Bitfinex has attracted a large number of high-net-worth investors (commonly referred to as 'whales'), with its BTC long position remaining high — currently about 60,000 BTC (spot leverage position), slightly lower than Binance's total long and short position of 80,000 BTC, making it a 'heavy engine' of market bullish and bearish forces.
You can search for Bitfinex directly here in the index.
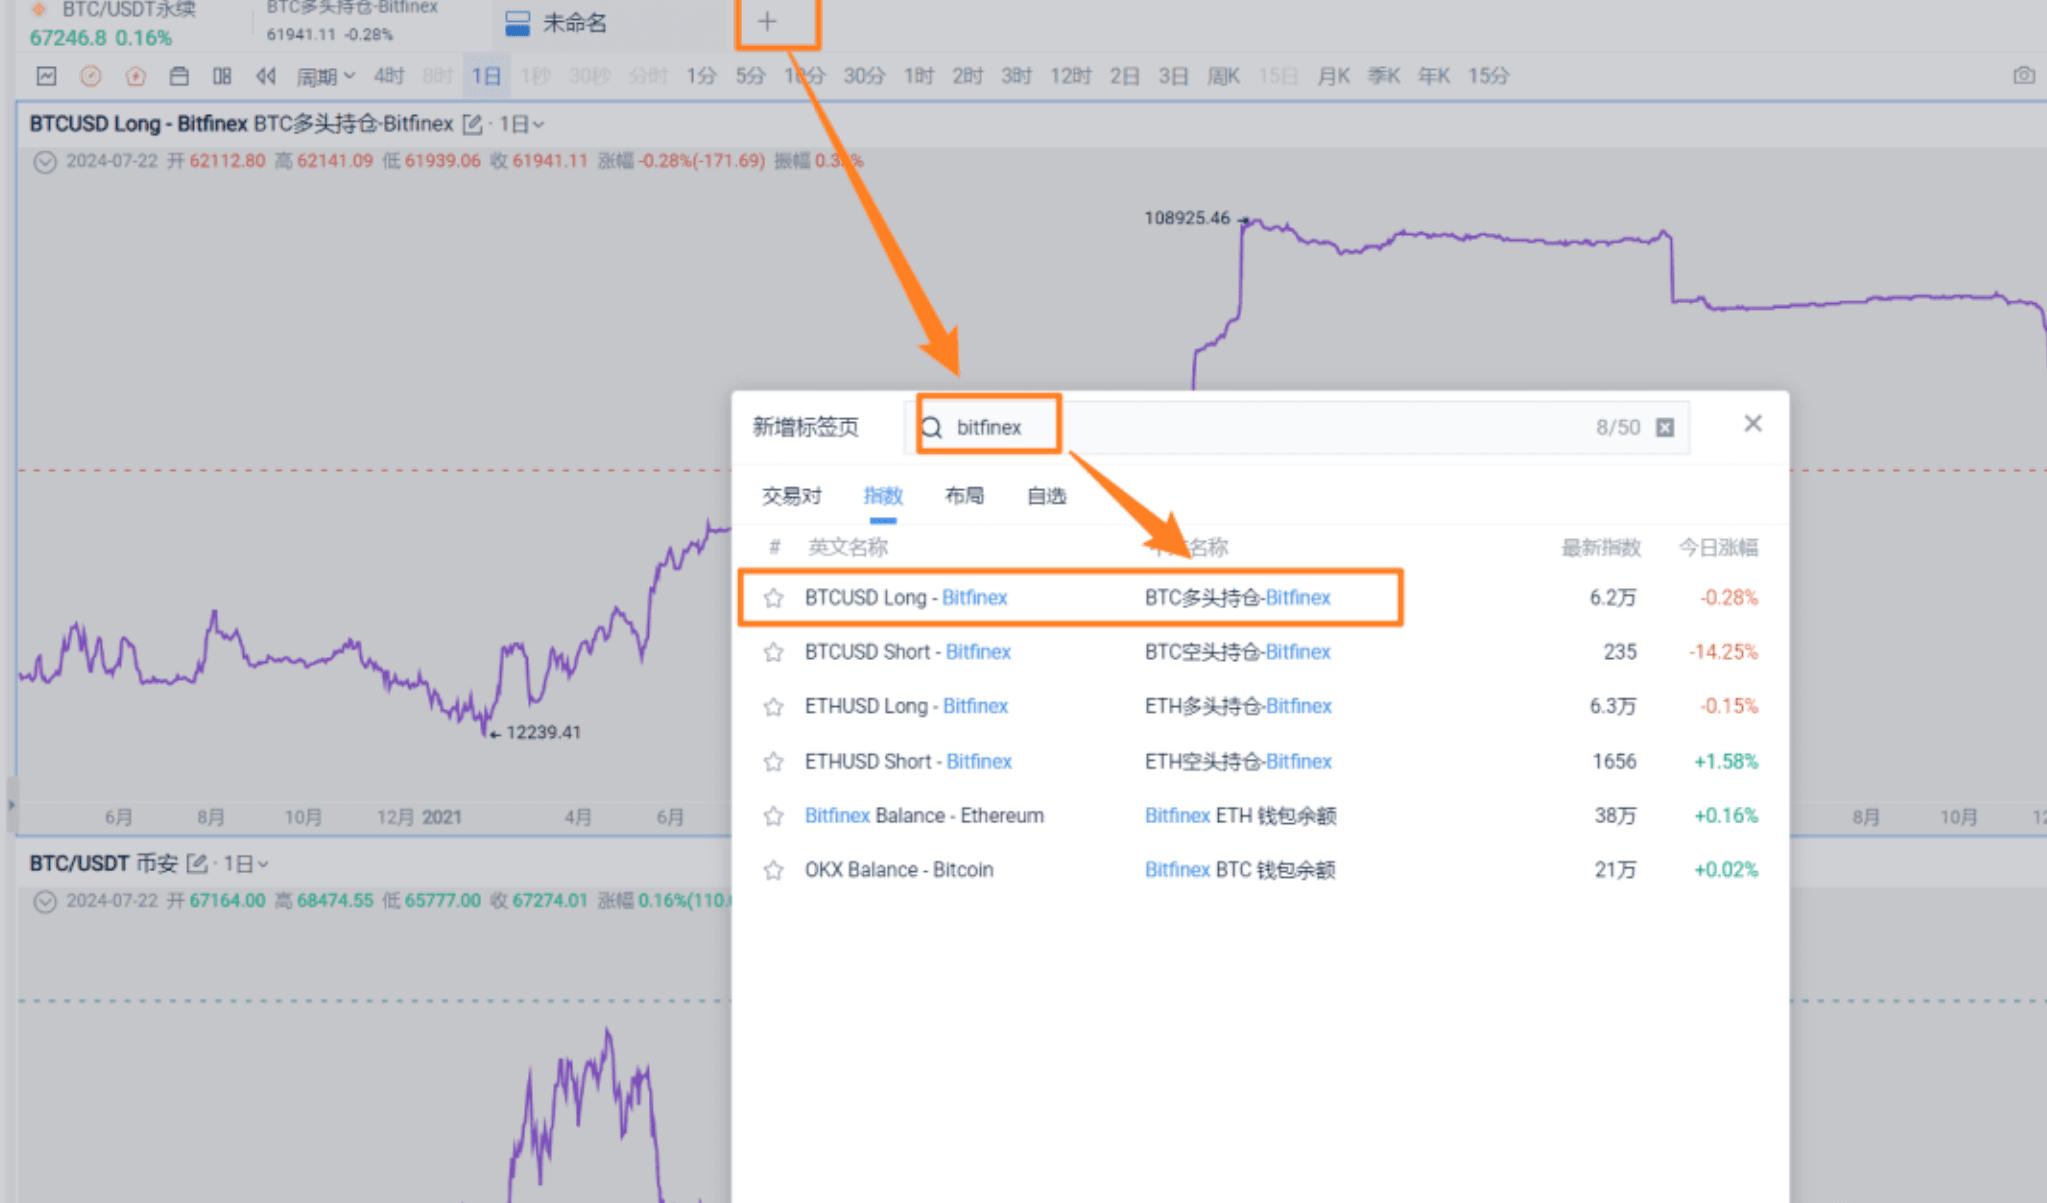
Comparing with the largest exchange, Binance, currently the total long and short position of BTCUSDT contracts on Binance is 80,653.7 BTC (valued at around $5.5 billion), while Bitfinex has about 60,000 BTC in long positions, which is abnormally high.
2. How do long positions affect prices?
The 'smart money' of reverse operations: Whales tend to increase holdings when BTC falls and reduce holdings when it rises. For example, in October 2023, as BTC ETF expectations warmed, long positions continued to increase; but after BTC hit a new high of $70,000 in March 2024, whales began to retreat in batches, resonating with short-term peaks.
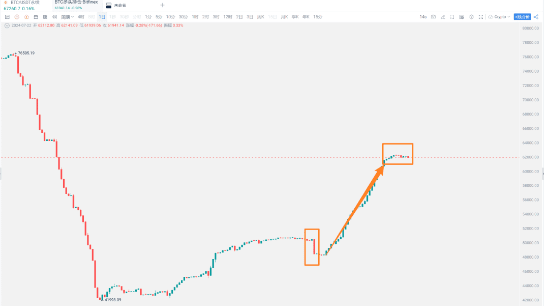
Limitations of indicators: Although changes in long positions do not completely sync with high and low price points (no one can accurately time the market), long-term trends are worth referencing. For example, about a month ago, Bitfinex long positions showed a 'downward gap', and subsequently, BTC prices retraced for a few days, indicating whales' early response to short-term risks.
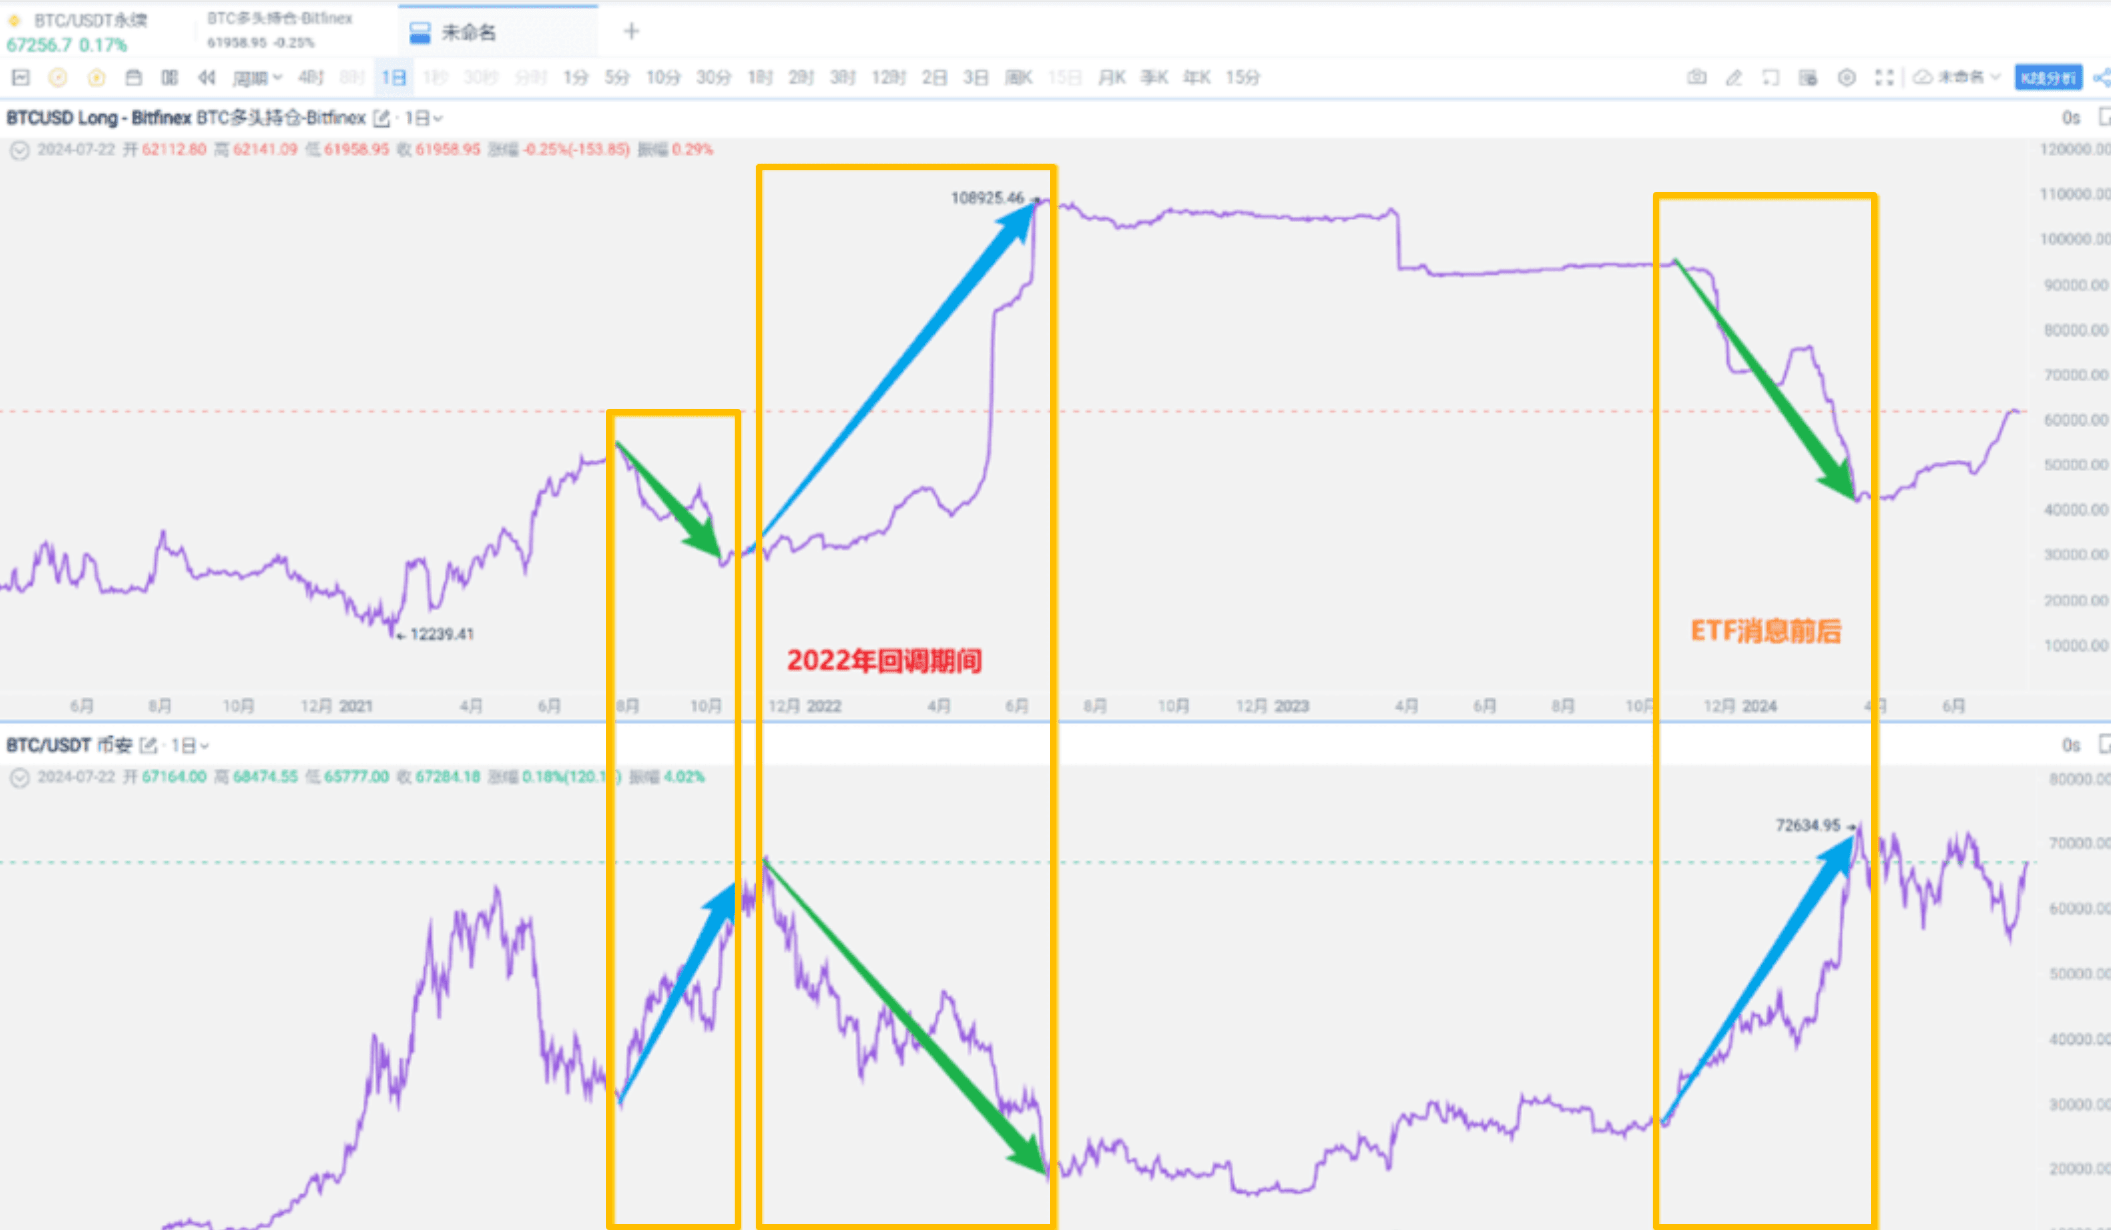
Recently, in October 2023, news of a spot BTC ETF emerged, and since then, Bitfinex's BTC long positions have been rising, indicating that whales are optimistic.
When does the upward trend change? It was when BTC hit $70,000 in March that whales began to retreat. Looking back from 2021 to 2022, this trend was even more evident. Whales tend to accumulate during downtrends and reduce holdings during uptrends.
This is a BTC indicator; the ETH validity is slightly worse. About a month ago, this indicator showed a downward gap, and subsequently, BTC prices declined for a few days.
3. UTXO Age Distribution: A 'X-ray' of Cost Basis.
1. UTXO: A 'timestamp' for tracking chip history.
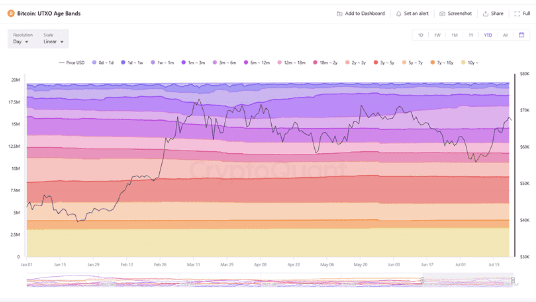
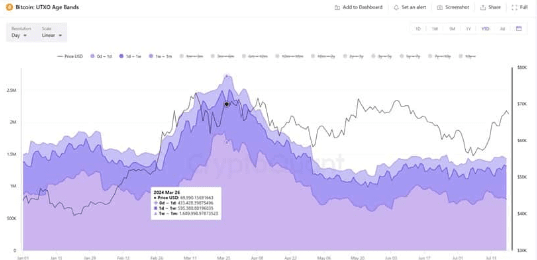
UTXO (Unspent Transaction Outputs) records the time and price of each BTC's last transaction. By analyzing the proportion of UTXOs over different time periods, we can clearly see the cost distribution between short-term speculators and long-term holders in the market.
2. Short-term vs Long-term Holders: Who is Making Money?
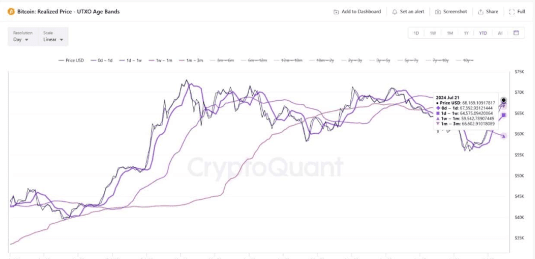
And in conjunction with the corresponding UTXO's realization price, it can be understood as the real-time price of trading BTC over different time periods.
Short-term Holders (within 1 month)
Costs are concentrated between $59,000 (1 week - 1 month) and $67,000 (0-1 day); the current BTC price is between $94,000 - $95,000, indicating that this portion of chips generally profits 30%-60%. Among them, the chips bought during the German government’s sell-off in March 2024 (1 week - 1 month UTXO) have the largest profit margin.
Long-term Holders (over 3 years)
Average costs are as low as around $30,000, accounting for about 20%, making it the most stable 'ballast' in the market. The cost for miners is influenced by halving cycles, electricity prices, and other factors, currently estimated roughly around $60,000; being below spot prices means miners' selling pressure is temporarily controllable.
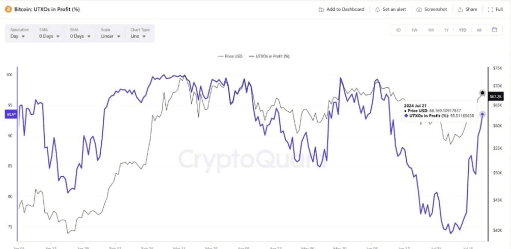
Currently, 93% of BTC is in a profit state, indicating that most investors have 'paper profits', but the funds that chased the high point of $70,000 on March 7 are still not out of the water. This structure means that short-term profit-taking may trigger sell-offs at resistance levels (such as $100,000), while the cost support of long-term holders (at $70,000) will become a key defense line.
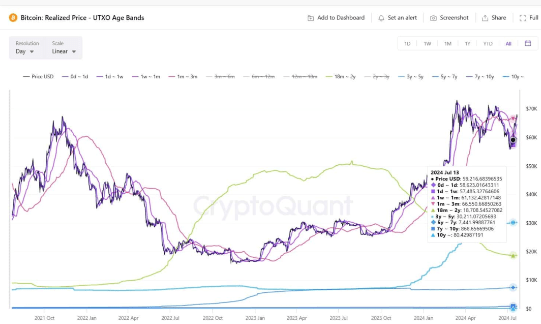
Holding for over 3 years, with an average cost around $30,000. The costs for miners vary over different time periods, influenced by halving cycles, mining machine calculations, electricity costs, and operating expenses, making it complex. Currently, rough estimates put miner costs around $60,000.
How can the three signals guide practical operations?
Exchange Reserve Volume: Be wary of abnormal fluctuations from a single exchange and pay attention to reserve declines driven by institutional accumulation.
Bitfinex Long Positions: Control high chase positions when whales reduce their holdings and pay attention to buying opportunities during pullbacks.
UTXO Cost Band: Short-term resistance levels ($96,000 - $100,000) require caution.
Beware of profit-taking; long-term support levels ($60,000 - $70,000) can be gradually positioned.
The market is always evolving through competition, and these three signals are not a 'guaranteed winning formula', but they can help us understand capital flows, perceive bullish and bearish sentiments, and anchor cost basis.
Remember: On-chain data is a rearview mirror, not a telescope — only by combining the macro environment and market expectations can data truly serve trading decisions.
If you are also a tech enthusiast feeling helpless and confused about trading, wanting to learn more about cryptocurrency and get first-hand cutting-edge information, click on my avatar to follow me and never get lost again! If you can see the market clearly, you can act with confidence. Steady gains are far more practical than fantasies of getting rich.
