🔥🟥Key Information about $Tut
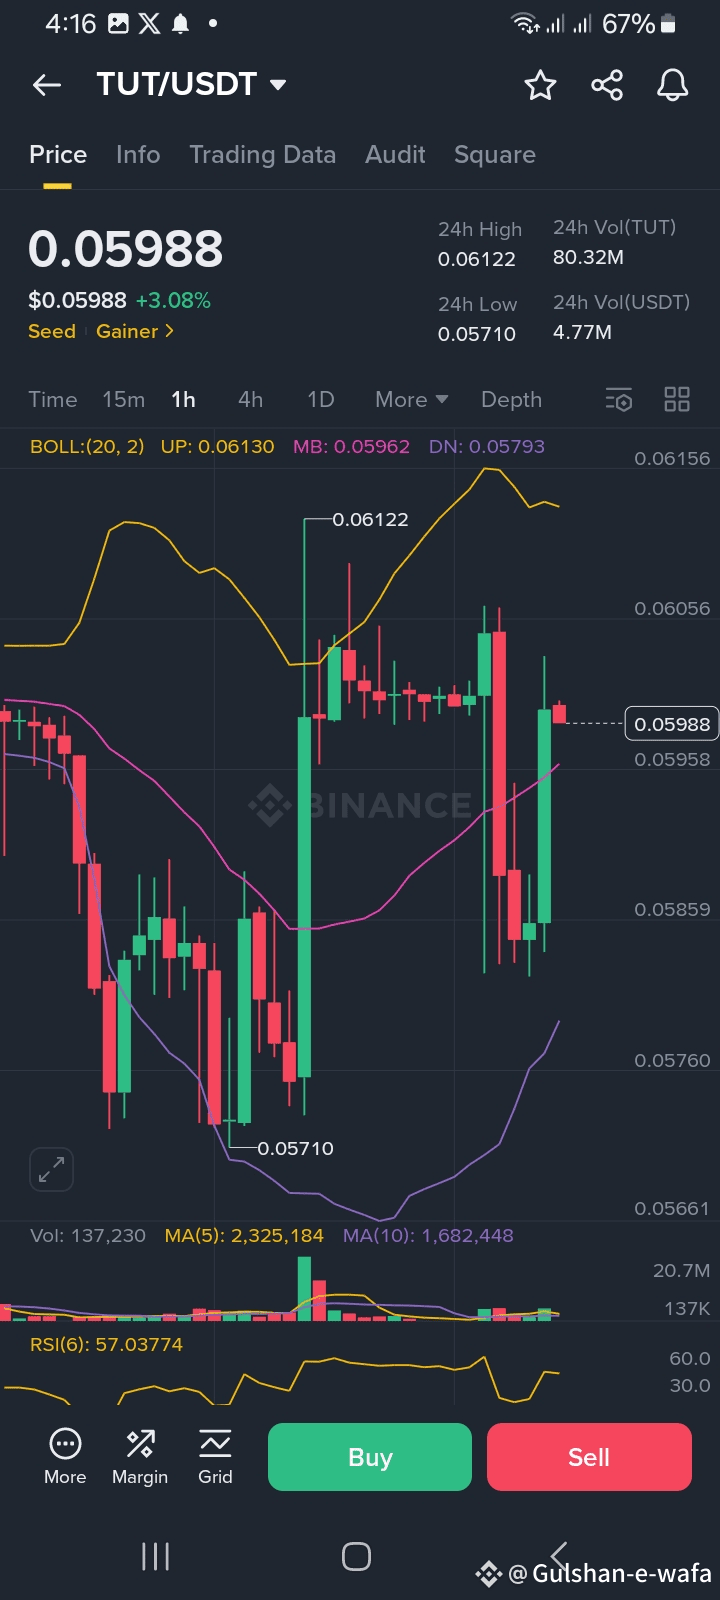
🟠🟢Current Price: 0.05988 USDT, with a 3.08% increase over the past 24 hours.
🟤24-Hour High: 0.06122 USDT.
🟡24-Hour Low: 0.05710 USDT.
🟢24-Hour Volume: 80.32 million ✔️TUT tokens traded, equivalent to 4.77 million USDT.
Recent Price Movement: The chart shows a significant price spike to around 0.06122 USDT, followed by a slight pullback to the current price of 0.05988 USDT.
Technical Indicators:
Bollinger Bands (BOLL): These are used to measure volatility and identify potential overbought or oversold conditions.
Upper Band (UP): 0.06130 USDT.
Middle Band (MB): 0.05962 USDT.
Lower Band (DN): 0.05793 USDT.
The current price (0.05988) is near the middle band, suggesting the price is within a normal range relative to recent volatility.
Moving Averages (MA): These smooth out price data to identify trends.
A yellow line (likely MA 10) and a purple line (likely MA 5) are shown, indicating short-term price trends.
Relative Strength Index (RSI): At 57.03774, this indicator suggests the asset is neither overbought (above 70) nor oversold (below 30), meaning the price is relatively stable.
✅️Volume: The chart shows trading volume bars at the bottom, with the current volume at 137,230 TUT tokens. Green bars typically indicate buying volume, while red bars indicate selling volume.
⏺️Chart Features:
Candlesticks: Each candlestick represents one day of trading, with green indicating price increases and red indicating decreases.
💥📈Price Levels: Horizontal lines mark key levels, such as recent highs (0.06156) and lows (0.05710), which can act as resistance and support levels.
Buy/Sell Options: The green "Buy" and red "Sell" buttons at the bottom suggest the user can trade TUT/USDT directly from this interface.
🔴💥Sum Up
The chart indicates that TUT/USDT has experienced a recent price increase of 3.08%, with the current price at 0.05988 USDT. The technical indicators suggest the asset is in a relatively stable state, neither overbought nor oversold, and the price is fluctuating within expected volatility ranges.
The chart provides tools for traders to analyze trends and make informed decisions about buying or selling the token.