
According to technical analysis, the XRP token may rise by 20% by the end of August.
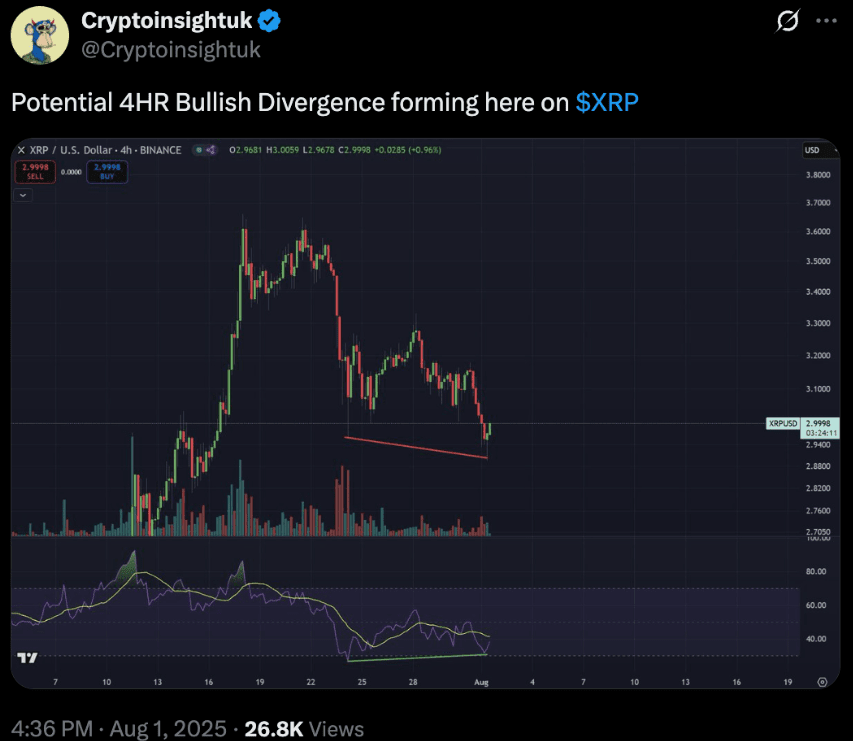
On the four-hour candlestick chart, XRP is displaying a bullish divergence, a widespread signal often indicating a potential trend reversal. In this case, the cryptocurrency's price is forming lower lows, while the relative strength index (RSI), a momentum indicator, is forming higher lows. This discrepancy suggests that recent selling pressure is weakening. Another bullish signal comes from the daily XRP chart, where the price is forming a candlestick pattern known as 'Dragonfly Doji'. This candle has a long lower wick and practically no upper shadow, with the opening and closing prices being near the upper part of the candle. This indicates that buyers have actively entered the game after the early selling pressure. The price of XRP rose approximately 65% after a similar 'Doji candle' was formed in April. In the coming days, a rise of 20% may occur in the range of $3.60 to $3.65 if the price breaks the upper trendline of the wedge and compares to the Fibonacci line 0.236 around the level of $3.07.#Write2Earn #Write2Earn! $XRP
