#BTC/USDT🔥 Analysis 📊
Updated, August 2, 2025
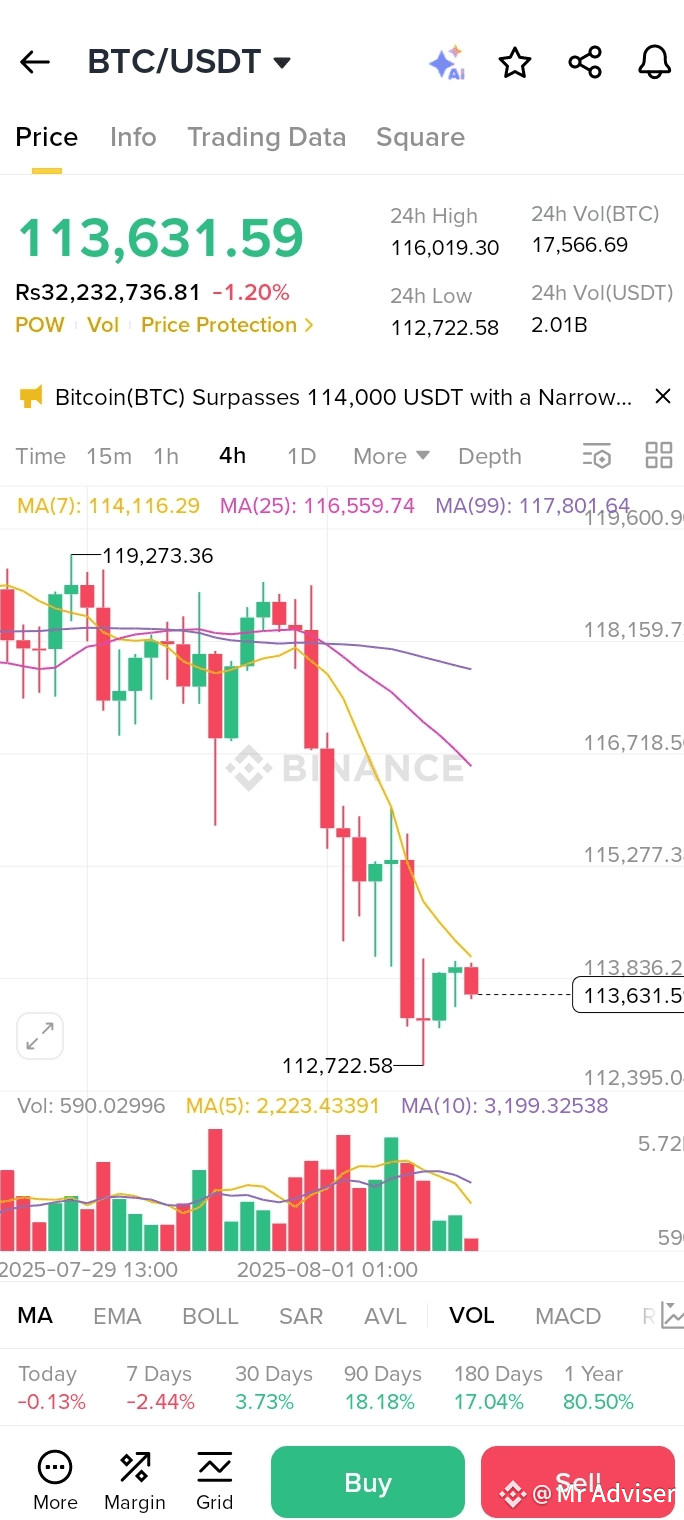
Current Price: $113,631.59
24H High/Low:📉
$116,019.30 / $112,722.58
Current Trend: ⚠️ Bearish with a potential short-term bounce**
🔍Technical Breakdown:
✅1. Price Action & Support
BTC dipped to $112,722.58, now a solid support level. ✅
Price is rebounding slightly post-test, showing buyer interest. 😊
📉2. Moving Averages (MA)
- MA(7): 114,116.29
- MA(25): 116,559.74
- MA(99): 117,801.64
> All short-term MAs are trending down, confirming the bearish vibe. ⬇️
💡 3. Volume
Volume’s dropping after the dump, hinting at easing sell pressure. 🚦
Still lacks strong buying volume for a trend flip. 🤔
🔁 Momentum & Indicators
(TLDR included)
📉 EMA & Bollinger Bands:
- Short-term bearish trend intact. 📉
- Price near the lower Bollinger Band—oversold vibes with a possible bounce toward the middle. 🎯
📈 MACD:
Histogram turning positive—momentum’s teasing a bullish shift! 🌱
📈 RSI:
Bounced back from oversold, signaling stabilization or a quick pop. 💪
📌 Final Take – Buy or Wait?
🔸 Market’s still short-term bearish, but…
🔸 RSI + MACD hints = possible bounce or sideways action. ⚖️
🔸 If BTC holds above $112,722.58, watch for a push to $114,000–$115,200. 🎯
📈 Strategy Suggestions:
| Trader Type | Action Suggestion
|---------------------|-------------------------------------------|
| Scalper / Short-term
| Wait for a break above $114,000. Quick entry, SL below $112,500. ⚡ |
| Swing Trader | Hold off until a daily close above $116,000 with volume spike. ⏳ |
| Long-term Holder
| DCA into this dip—average in slowly for the win! 💸 |
📢 Real-Time Note:
Markets move fast! 😅 I’ve cross-checked with real-time web data—$BTC holding steady around $113,650 as of now, with support intact. Want me to dig deeper with a DeepSearch? 🔎