The current price of $USTC in USDT is 0.01336, which represents a 5.03% increase. The 24-hour high is 0.01376, and the 24-hour low is 0.01257. The 24-hour trading volume in USTC is 233.36 million, and in USDT, it is 3.10 million.
The chart includes Bollinger Bands (20, 2), with the upper band at 0.01370, the middle band at 0.01323, and the lower band at 0.01275. The price levels on the right side of the chart range from 0.01235 to 0.01395, with the current price of 0.01336 marked by a horizontal dashed line.
The candlestick chart displays the price movement of USTC/USDT over the 1-day period. The candlesticks are primarily green (indicating price increases) and red (indicating price decreases). The price initially shows a downward trend, reaching a low of 0.01242, followed by a recovery and a sharp upward movement toward the 24-hour high of 0.01376. After reaching the peak, the price slightly retraces but remains above the middle Bollinger Band, closing at 0.01336.
The volume indicator shows the trading volume for each candlestick, with green and red bars corresponding to the candlestick colors. The volume fluctuates, with notable spikes during significant price movements, such as the sharp upward move toward 0.01376. The total volume for the displayed period is 952.461 units.
Two moving averages are displayed below the volume indicator: MA(5) at 17,366.601 (yellow line) and MA(10) at 11,285.134 (purple line). The MA(5) is above the MA(10), indicating a short-term bullish trend as the shorter moving average is trending above the longer one. The moving averages show a general upward trend, aligning with the price increase.
The RSI(6) indicator is displayed at the bottom of the chart, with a value of 50.833706. The RSI scale on the right ranges from 0 to 100, with key levels marked at 30 (oversold), 70 (overbought), and 50 (neutral). The RSI line (yellow) fluctuates around the 50 level, indicating neutral momentum. The RSI shows a slight upward trend toward the end, aligning with the recent price increase, but it has not yet reached the overbought territory (above 70).
At the bottom of the screen, there are two prominent buttons: a green "Buy" button on the left and a red "Sell" button on the right. Additional options are visible, including "Trade," "Margin," and "Grid," suggesting different trading modes available on the platform.
The chart indicates a recent bullish trend for USTC/USDT, with the price recovering from a low of 0.01242 to a high of 0.01376 and closing at 0.01336. The Bollinger Bands show increasing volatility, with the price staying above the middle band, suggesting continued bullish momentum. The moving averages and RSI support the bullish sentiment, with the MA(5) 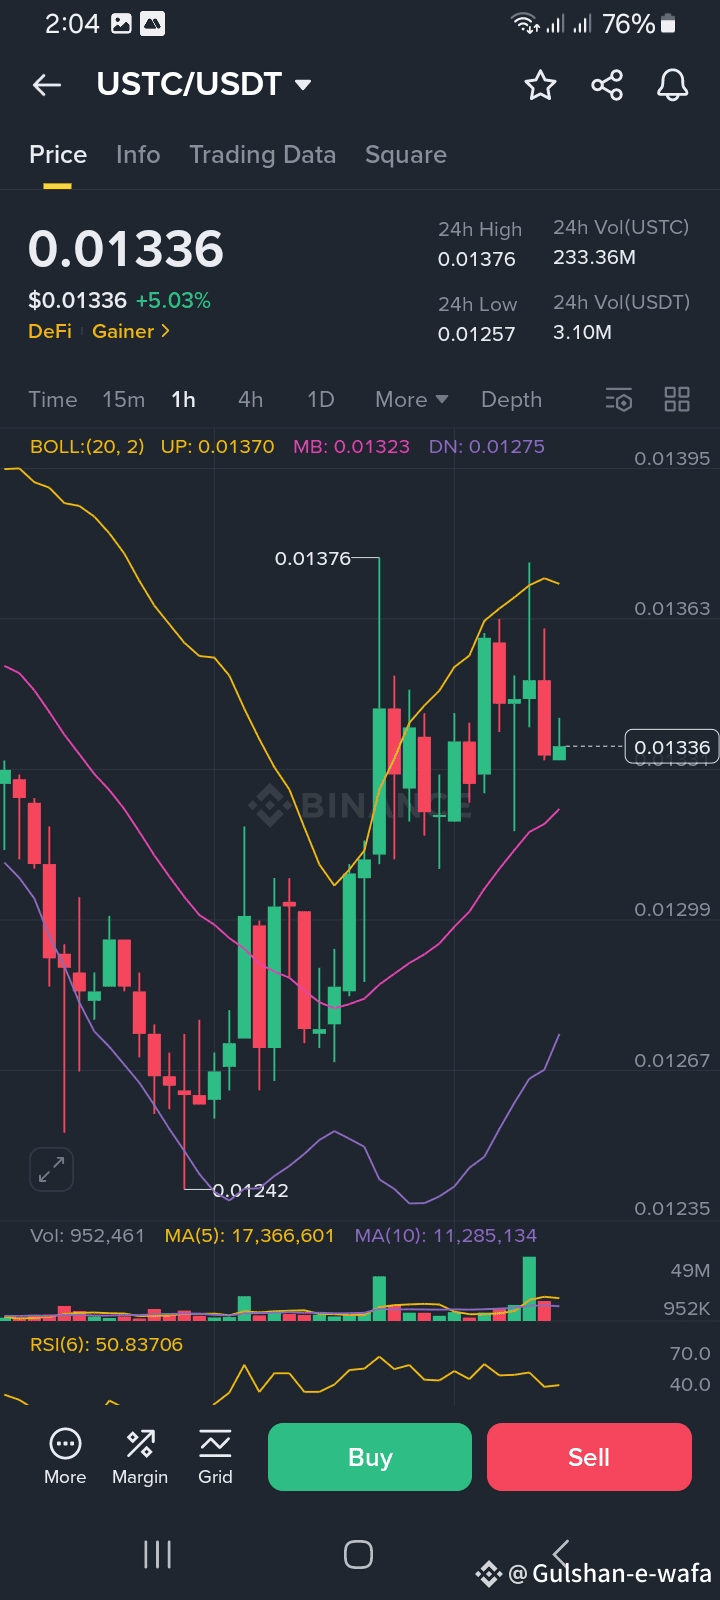 above the MA(10) and the RSI trending toward the higher end of the neutral zone. The volume spikes during the price increase indicate strong buying interest, which may have driven the upward movement.
Considering this analysis, if the user is looking to trade, they might consider buying USTC/USDT, as the indicators suggest a bullish trend. However, they should also be aware of the potential for volatility and the possibility of a price correction.
