📒The Ultimate Guide to 8 Popular Trading Indicator Tools:
🔰 Introduction: Your Toolkit Is Your Edge:
Trading isn’t luck—it’s discipline, structure, and tool mastery. The market moves fast, and only those with precision setups stay ahead of the chaos.
Your edge lies in clarity, not prediction. Traders who win are those who can decode momentum, spot true trends, and manage risk with exact timing.
This guide isn’t a list—it’s a framework. You’ll learn how each tool works, why it matters, and how to apply it with conviction in real-time markets.
From filtering noise to strengthening your entries and exits, these indicators are the backbone of confident, strategy-driven execution.
Indicator Tools: Gauging Market Momentum and Volatility
📈 Exponential Moving Average (EMA) – Real-Time Trend Reactor for Fast Markets
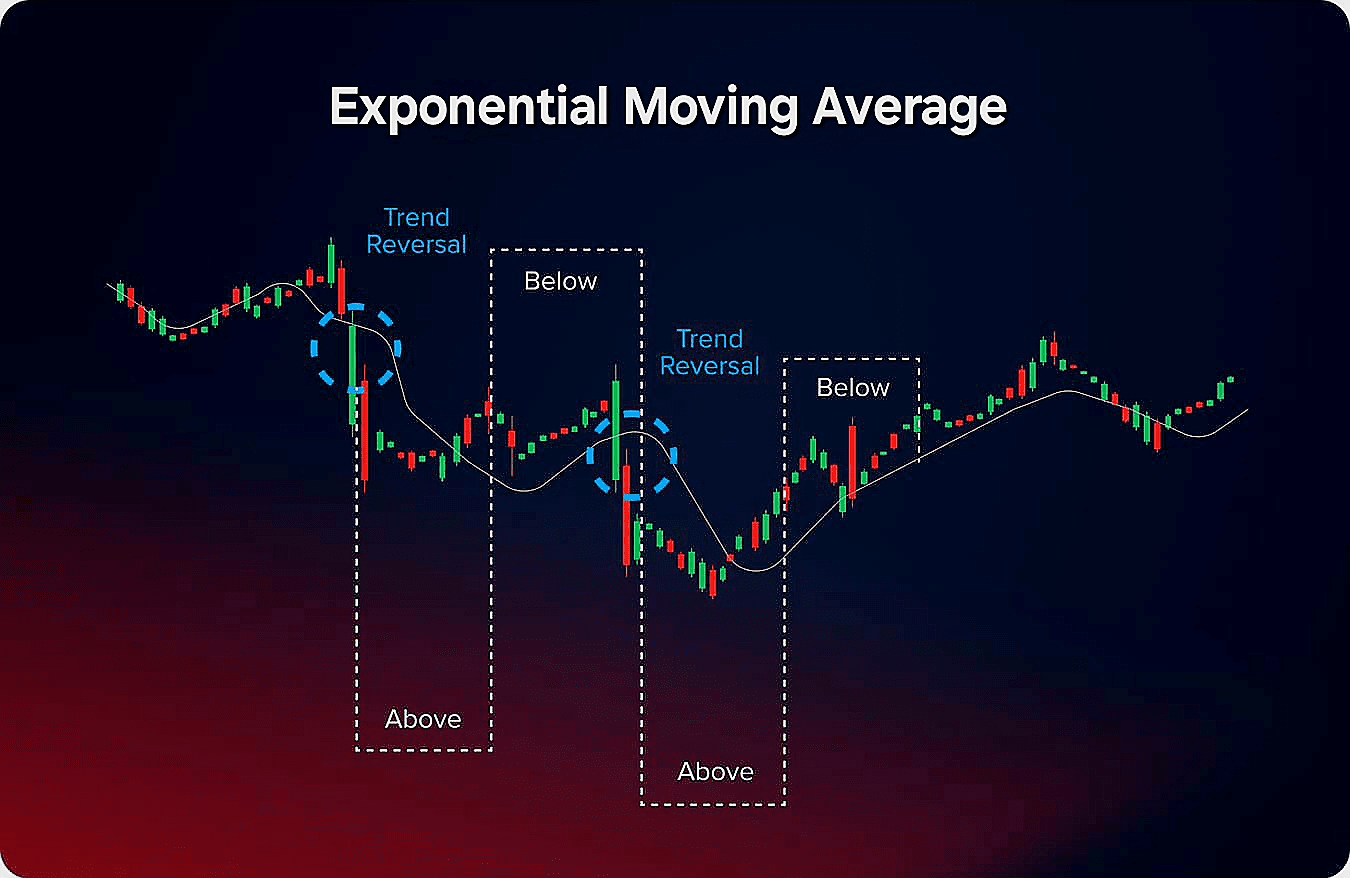
➡️ The EMA focuses on recent prices, reacting faster than the Simple Moving Average (SMA). It helps you spot trends, trigger buy/sell signals, and manage risk with speed.
⚙️How It Works:
✔️Smoothing the Chart:
Filters out small price moves so you focus on the real trend.
✔️Focuses on New Prices:
Gives more weight to the latest candles, ignoring older data.
✔️Quick Reaction:
Moves faster when prices change, helping you act in real time.
🔍How Use It:
✔️Spot Market Direction:
EMA slope shows whether price is trending up, down, or moving sideways.
✔️Crossover Signals:
When a short EMA crosses above or below a long EMA, it may trigger a buy/sell setup.
✔️Dynamic Support/Resistance:
Use EMAs as flexible zones to place stop-losses or take-profits.
✔️Momentum Strength:
Faster EMAs reveal how strong or weak the trend really is, improving timing confidence.
🎴Best For:
Traders who want quick reactions and clear entry/exit points. EMA periods like 9, 21, 50, and 200 fit different styles.
🗝️Example:
On a 15-minute chart, enter when the 9 EMA crosses above the 21 EMA in the trend direction.
🎯 Final Thoughts:
EMA is perfect for traders who want to follow recent market action, react quickly, and spot entries/exits with speed.
📌 If you want real-time signals, trend clarity, and momentum tracking, EMA is the tool to start with.
💪 Relative Strength Index (RSI) – Momentum Oscillator for Overbought & Oversold Timing
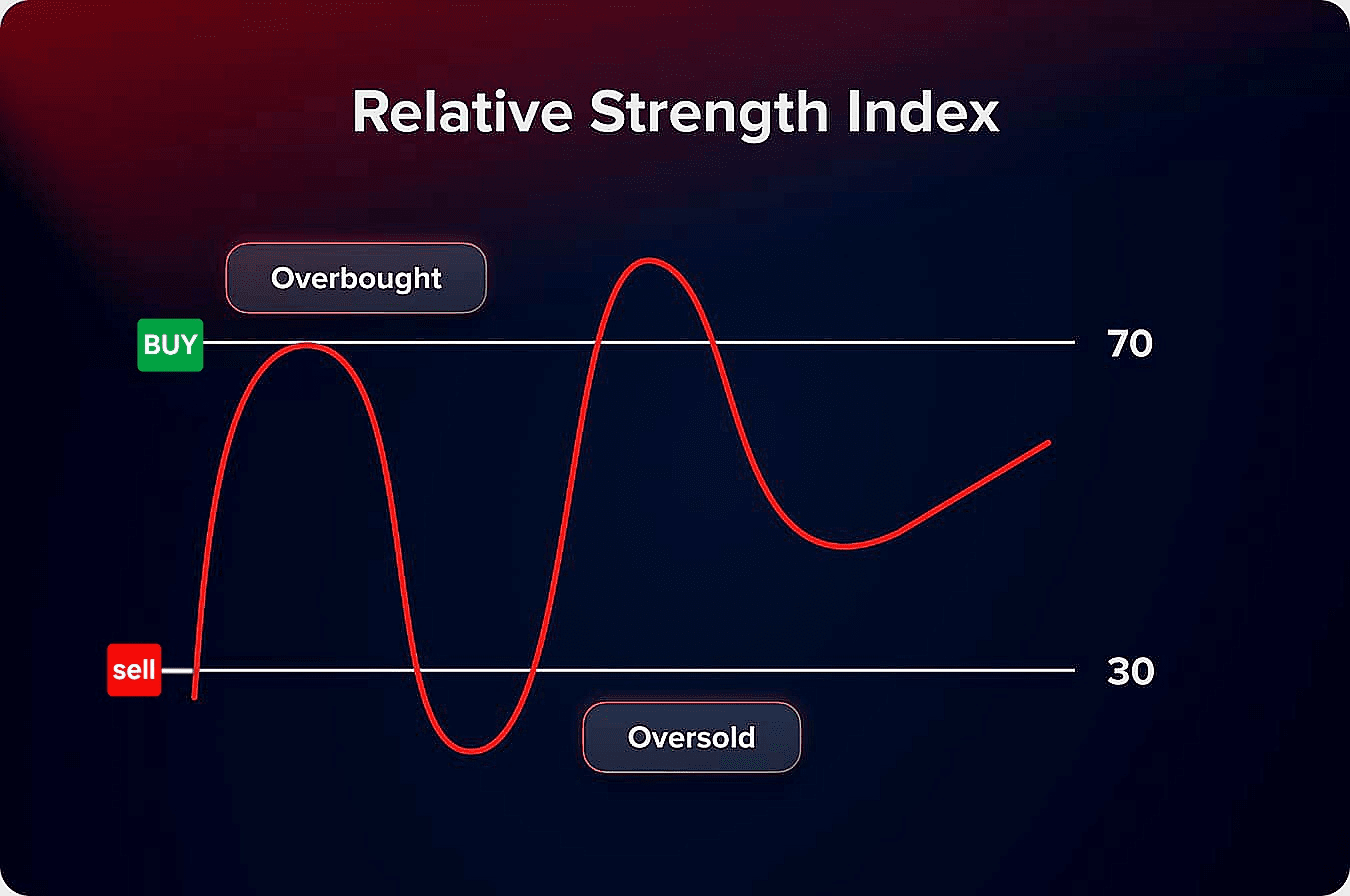
➡️ RSI measures how fast price moves, signaling when markets may reverse from extreme highs or lows.
⚙️How It Works:
✔️Momentum Oscillator:
Moves from 0 to 100 showing speed of price changes.
✔️Overbought/Oversold Zones:
Above 70 often means overbought; below 30 means oversold.
✔️14-Period Default:
Measures momentum over 14 candles.
✔️Divergence:
When price moves one way but RSI moves opposite, it warns of reversals.
🔍How Use It:
✔️Spot Market Extremes:
Use RSI to identify when price is overbought or oversold for possible turning points.
✔️Entry/Exit Signals:
Look for RSI crossing back into the normal range (30–70) to time entries and exits.
✔️Trend Confirmation:
Combine RSI with EMA or MACD to confirm whether momentum supports the trend.
✔️Divergence Detection:
Watch for bullish or bearish divergences between RSI and price to anticipate reversals.
🎴Best For:
Timing entries and exits, especially when combined with trend indicators.
🗝️Example:
On a 1-hour chart, price hits lower Bollinger Band while RSI is below 30 — a strong bounce setup.
📌Remember:
RSI can stay extreme in strong trends, so don’t rely on it alone.
📉 MACD (Moving Average Convergence Divergence) – Momentum-Driven Trend Confirmation
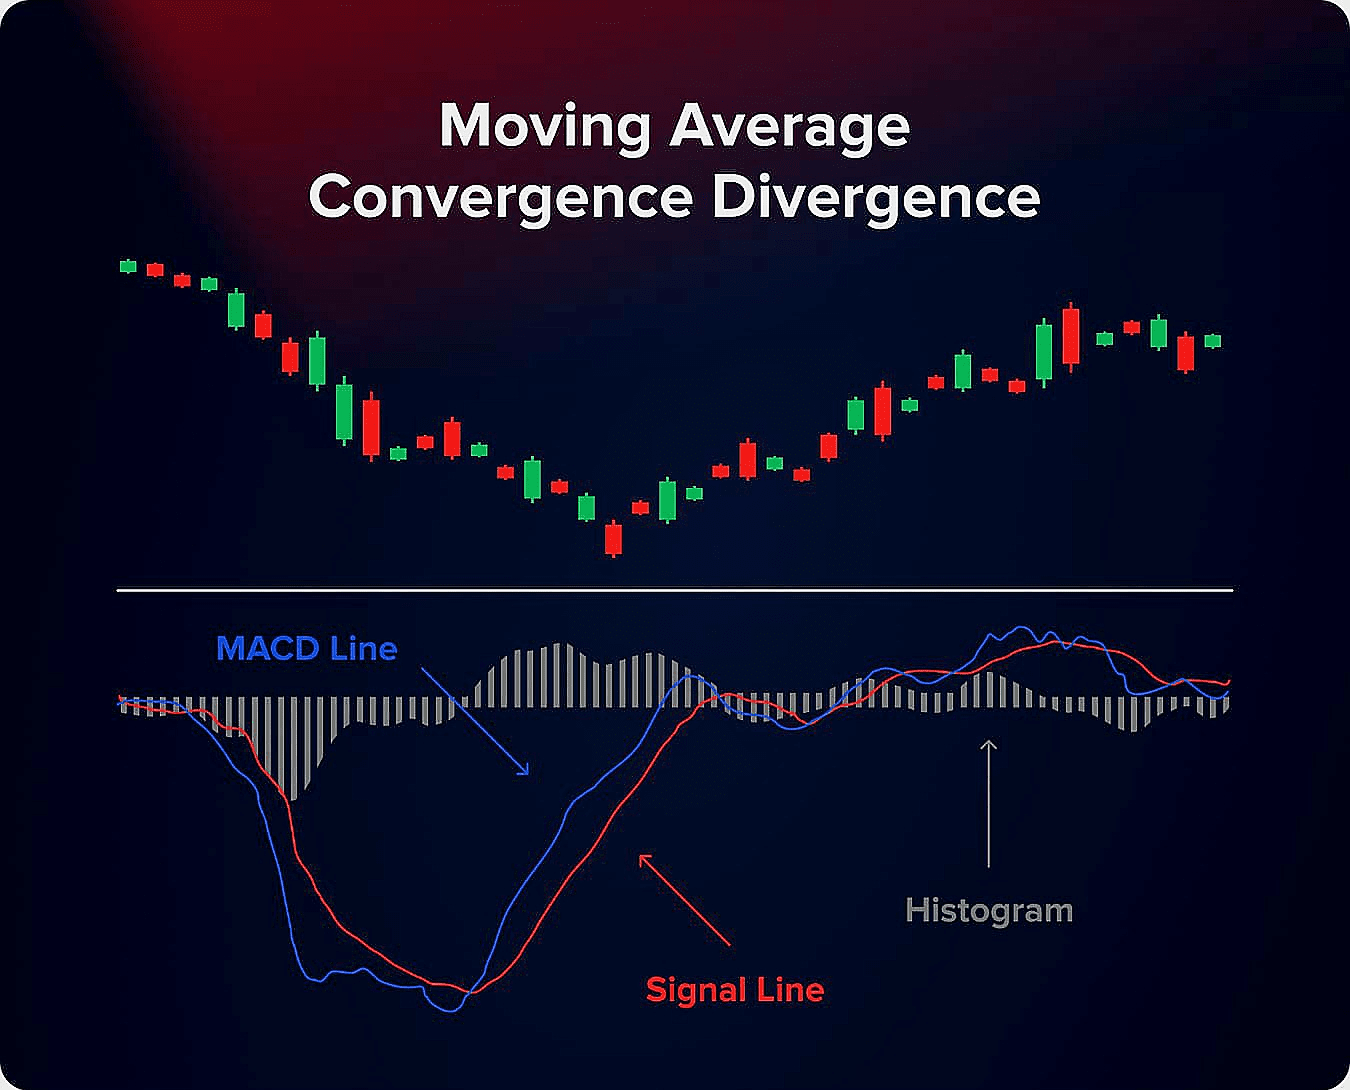
➡️ MACD uses two EMAs to identify trend direction, momentum, and potential reversals.
⚙️How It Works:
✔️Trend-Following Momentum Tool:
Tracks trend strength and momentum.
✔️Built on EMAs:
Compares 12-period EMA with 26-period EMA.
✔️Three Parts:
MACD line, Signal line, and Histogram.
🔍How Use It:
✔️Crossover Signals:
A bullish crossover (MACD above Signal) suggests a buy; bearish crossover signals a sell.
✔️Histogram Strength:
The size of the histogram bars reflects momentum — larger bars mean stronger moves.
✔️Divergence Clues:
When price moves one way and MACD another, it signals weakening trend strength.
🎴Best For:
Beginners and pros needing a clear snapshot of trend and momentum.
🗝️Example:
Bullish crossover above zero line signals a strong new uptrend and a confident long entry.
📌Remember:
MACD lags and can give false signals in choppy markets; confirm with other tools.
📏 Bollinger Bands – Volatility Envelope for Breakouts & Mean Reversions
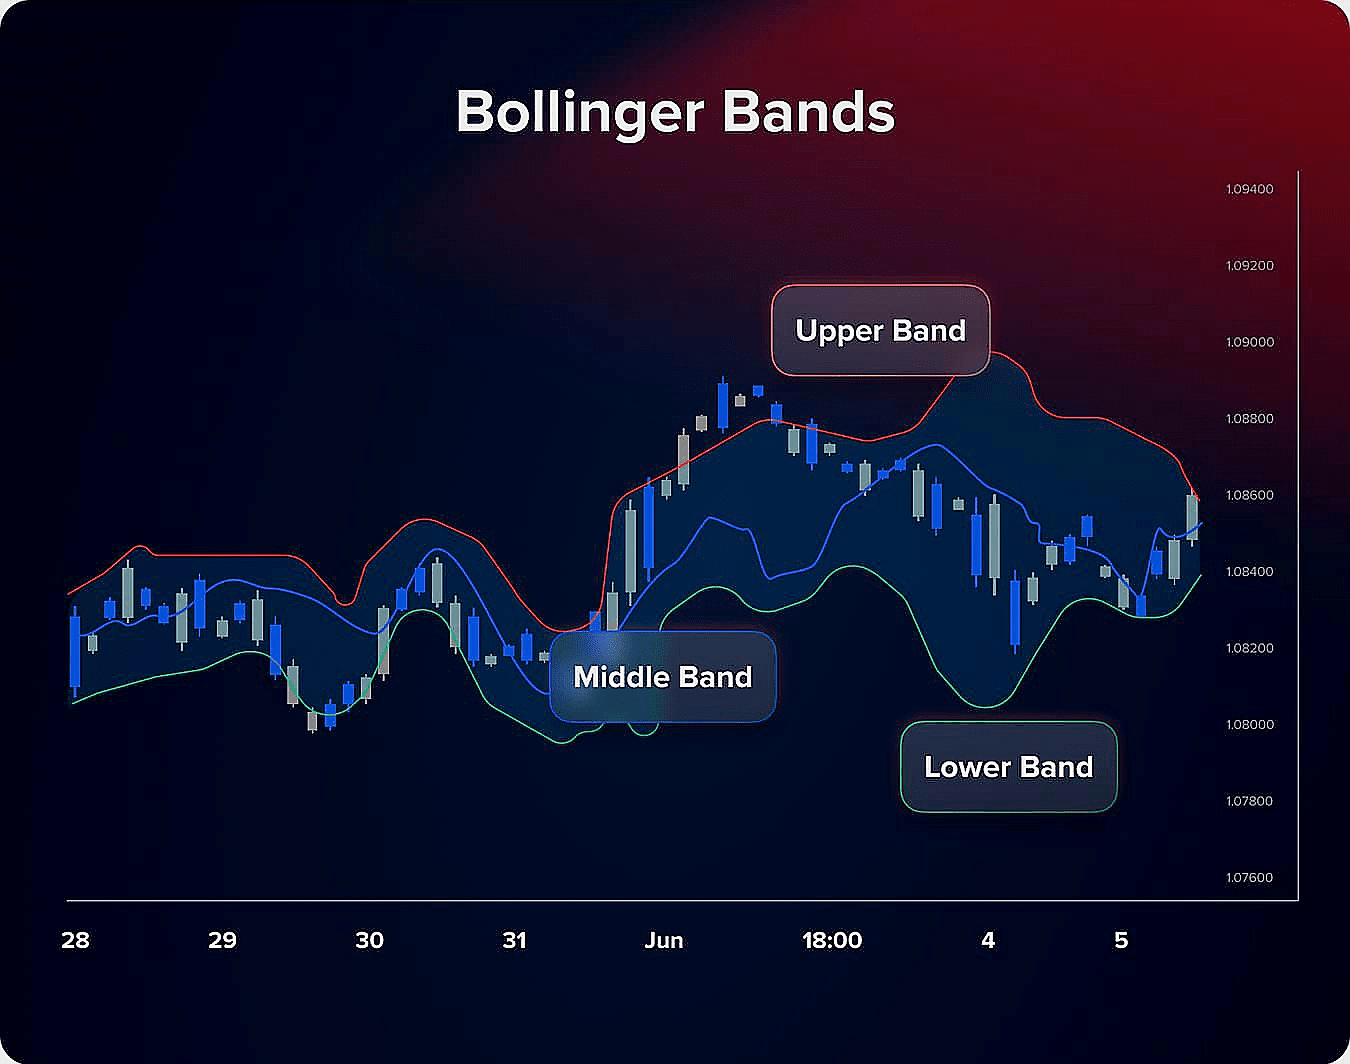
➡️ Bollinger Bands adjust with market volatility, helping you spot price extremes and potential reversals.
⚙️How It Works:
✔️Three Lines:
Middle SMA, upper band (+2 std dev), and lower band (-2 std dev).
✔️Dynamic Width:
Bands widen in volatile markets, narrow in calm markets.
🔍How Use It:
✔️Volatility Insights:
Wide bands signal high volatility; narrow bands suggest price consolidation.
✔️Reversal Signals:
Price hitting upper band may indicate overbought; lower band suggests oversold.
✔️Trend Riding:
In strong trends, price often hugs or "rides" the outer band.
✔️Pattern Setups:
W-Bottoms and M-Tops near bands may signal major reversals.
🎴Best For:
Swing and short-term traders focusing on volatility and mean reversion.
🗝️Example:
After a squeeze (narrow bands), watch for a breakout with band expansion. Trade in breakout direction.
📌Why It Matters:
Bollinger Bands flex with volatility, helping identify extreme price levels.
📐 Fibonacci Retracement – Pullback Mapping for Precision Entries & Exits
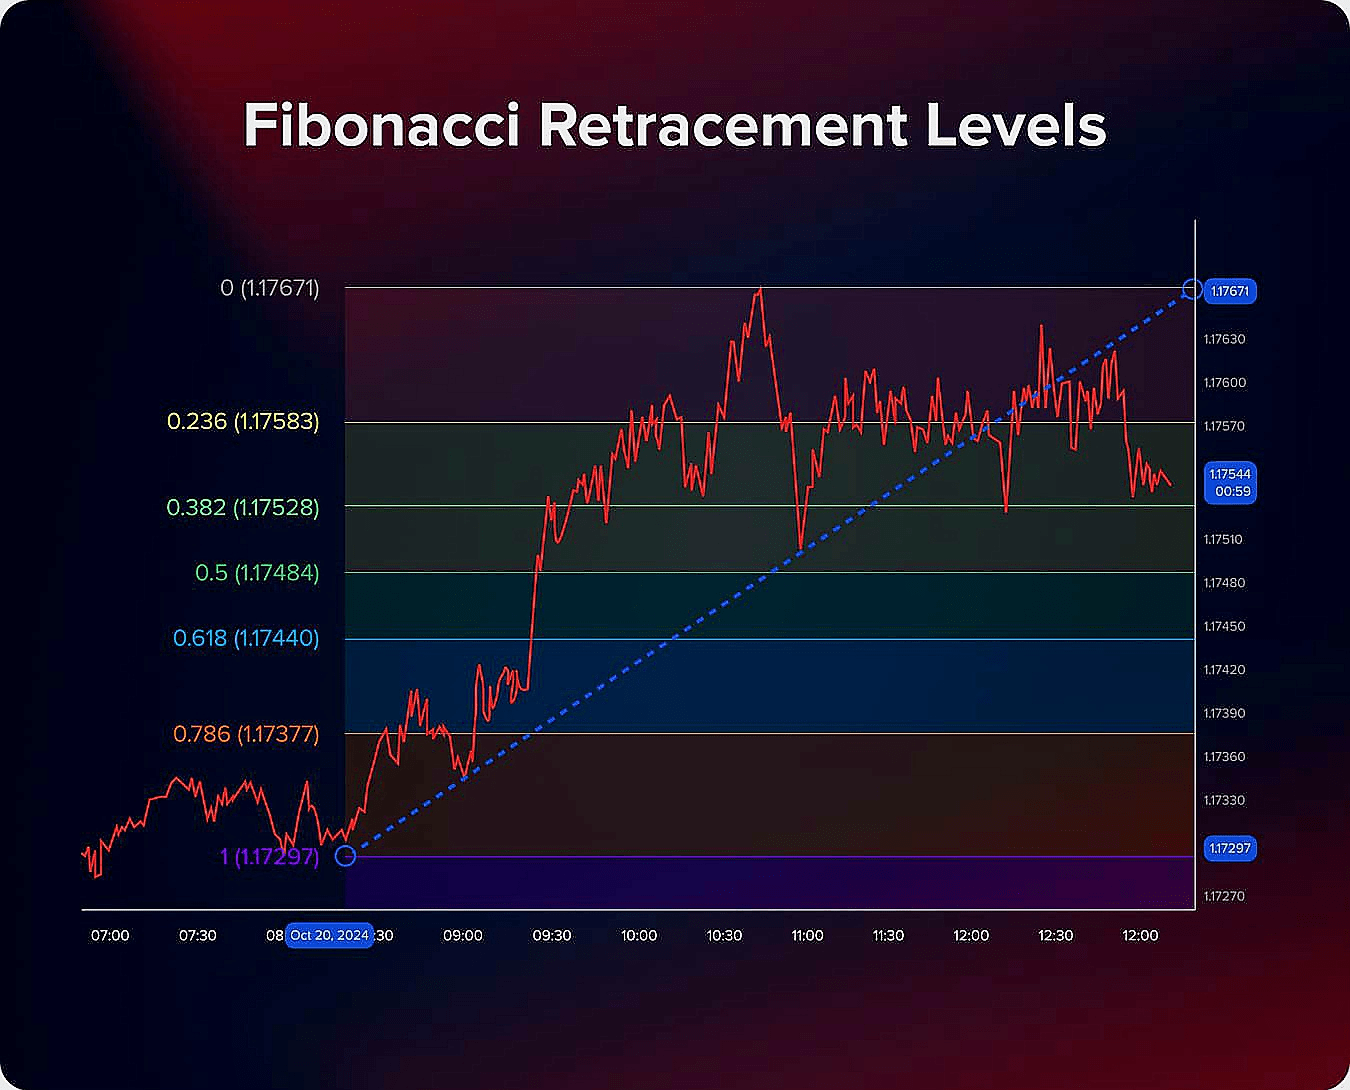
➡️ Fibonacci retracements highlight key support and resistance zones based on natural ratios.
⚙️How It Works:
✔️Identify Swing High & Low:
Mark the recent move’s high and low.
✔️Plot Levels:
Key zones at 23.6%, 38.2%, 50%, 61.8%, and 78.6%.
✔️Zones of Interest:
Areas where price may pause, reverse, or continue.
🔍How Use It:
✔️Entry Setup Zones:
Wait for price to approach key retracement levels and confirm with price action.
✔️Stop-Loss Placement:
Set stop losses just beyond major Fibonacci levels to protect against false moves.
✔️Target Projection:
Use Fibonacci extensions to set logical take-profit targets.
🎴Best For:
Traders working with clear trends seeking high-probability entries on pullbacks.
🗝️Example:
After an uptrend, enter near 61.8% retracement with a bullish candlestick confirmation.
📌Remember:
Fibonacci levels are zones, not guarantees. Confirm with volume or momentum indicators.
🔃 Stochastic Oscillator – Short-Term Reversal Signal for Momentum Shifts
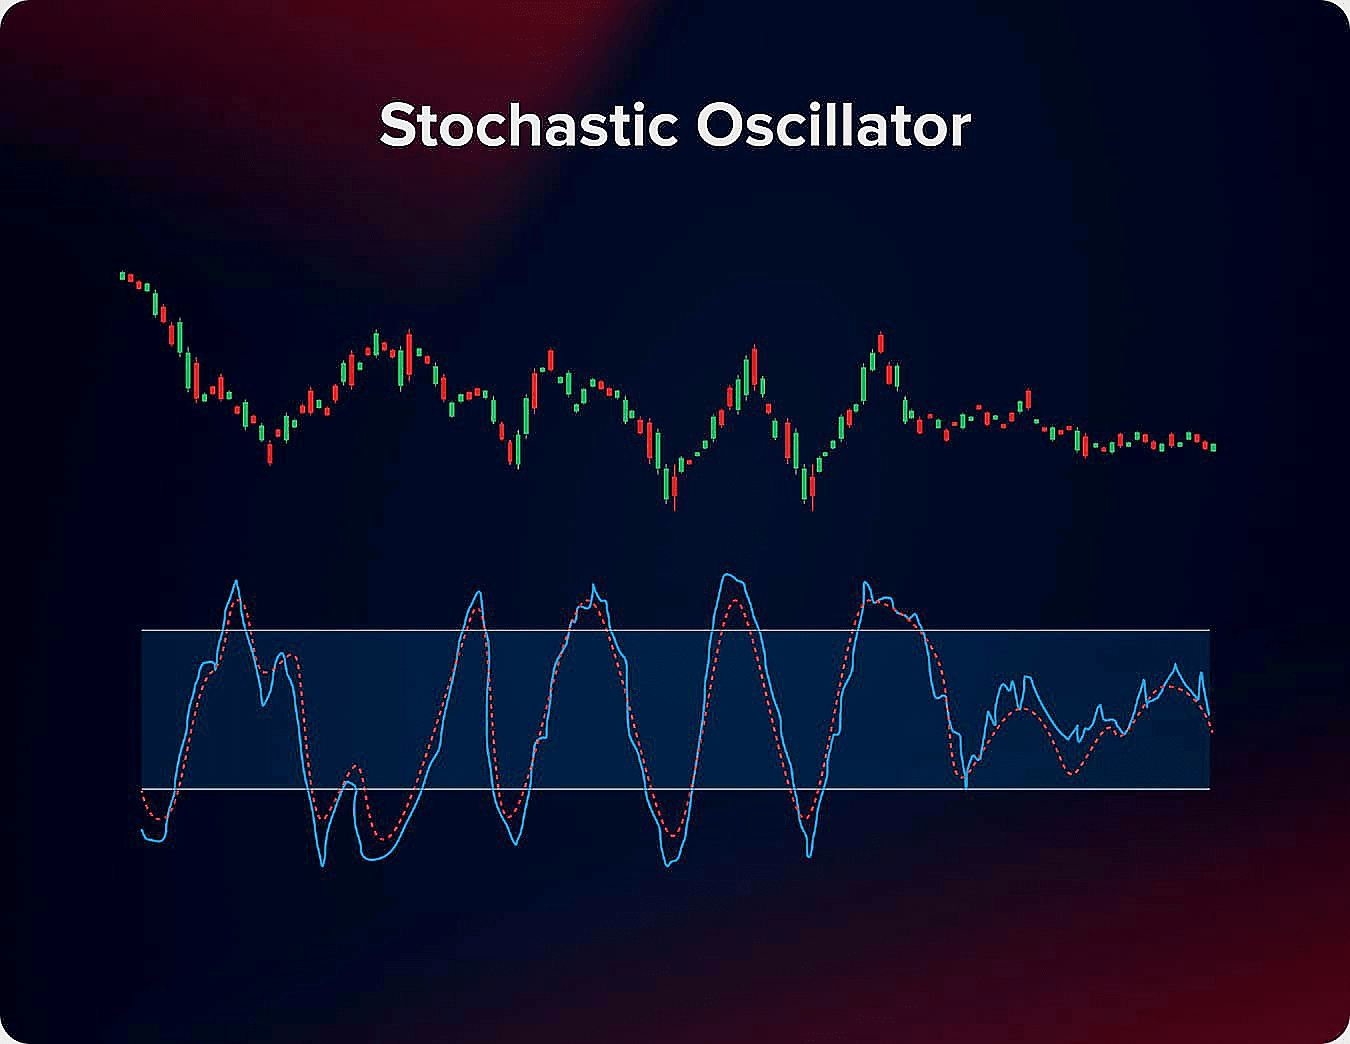
➡️ The Stochastic Oscillator shows overbought or oversold conditions to time quick reversals.
⚙️How It Works:
✔️Momentum Indicator:
Measures speed of price change on 0–100 scale.
✔️Overbought/Oversold:
Above 80 = overbought; below 20 = oversold.
✔️%K and %D Lines:
Fast (%K) and slow (%D) lines create crossover signals.
✔️Divergence:
Opposite moves in price and oscillator warn of weakening trends.
🔍How Use It:
✔️Extreme Zones:
Use overbought/oversold levels (80/20) to find potential reversal spots.
✔️Crossover Signals:
A bullish crossover (%K above %D) may indicate a short-term bounce.
✔️Divergence Signals:
Watch for price and oscillator moving in opposite directions as early reversal signs.
🎴Best For:
Day and short-term traders hunting quick momentum shifts in volatile markets.
🗝️Example:
Bullish crossover in oversold zone often leads to a short-term bounce.
📌Why It Matters:
It warns when the market’s momentum is too strong or too weak, helping you trade with momentum, not against it.
📊 Volume Weighted Average Price (VWAP) – Volume-Based Fair Value for Intraday Trading
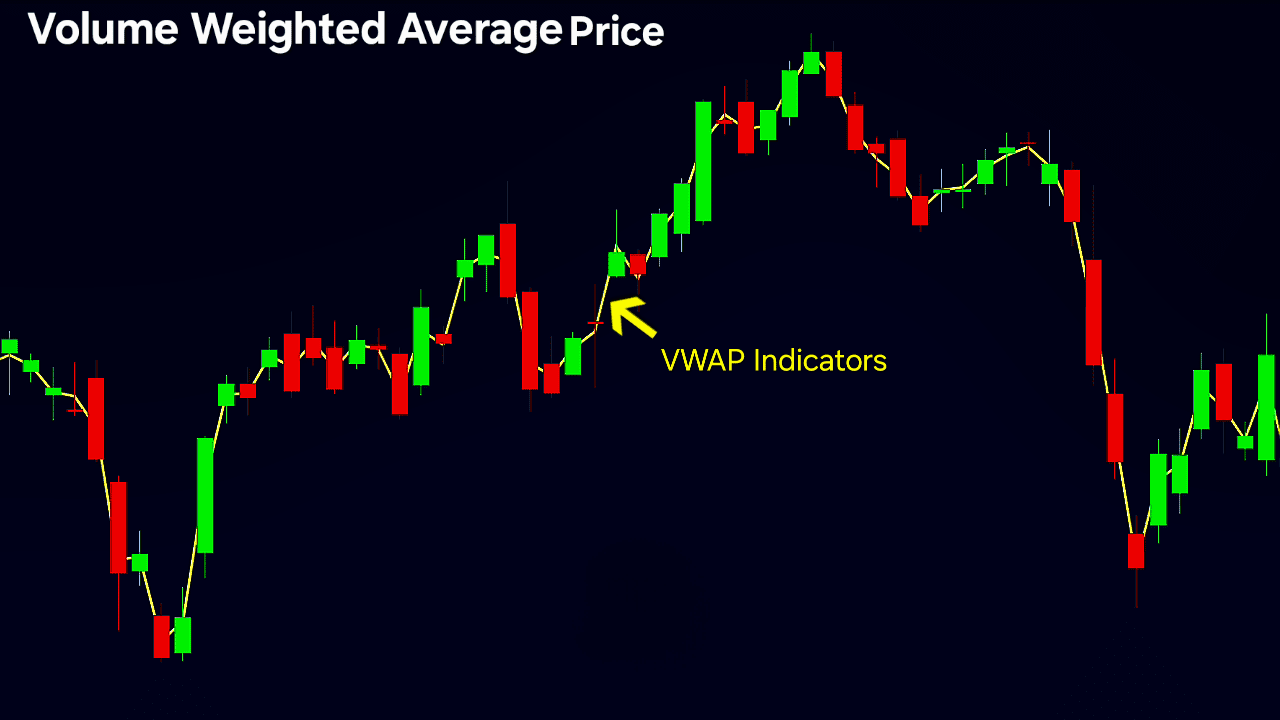
➡️ VWAP calculates the average price of an asset, weighted by volume, showing where real market value exists during the trading day.
⚙️ How It Works:
✔️ Live Volume Weighting:
Each candle's price is weighted by its volume, showing where large trades occurred.
✔️ Daily Reset:
VWAP starts fresh at market/session open and updates in real-time.
✔️ Trend Clarity Zones:
Above VWAP = buyer control; Below VWAP = seller control; Around VWAP = market indecision or chop zone.
🔍 How Use It:
✔️ Bias Filtering:
Use VWAP to confirm bullish/bearish intraday bias — align your trades accordingly.
✔️ Support/Resistance Tool:
Wait for price to bounce or reject off VWAP with strong candle + volume confirmation.
✔️ Volume Confluence:
Pair with volume spikes, RSI, or EMA to confirm breakouts and avoid false entries.
🎴 Best For:
Scalpers and day traders needing intraday entry clarity and real-time volume-backed validation.
🗝️ Example:
On a 5-min chart, price reclaims VWAP with bullish engulfing + rising volume → confirms long opportunity with fair value alignment.
📌 Remember:
VWAP works best in high-liquidity markets and during active hours. It resets daily — avoid using it for swing or overnight trades without anchoring.
🧮 On-Balance Volume (OBV) – Volume Flow Predictor for Trend Strength & Divergences
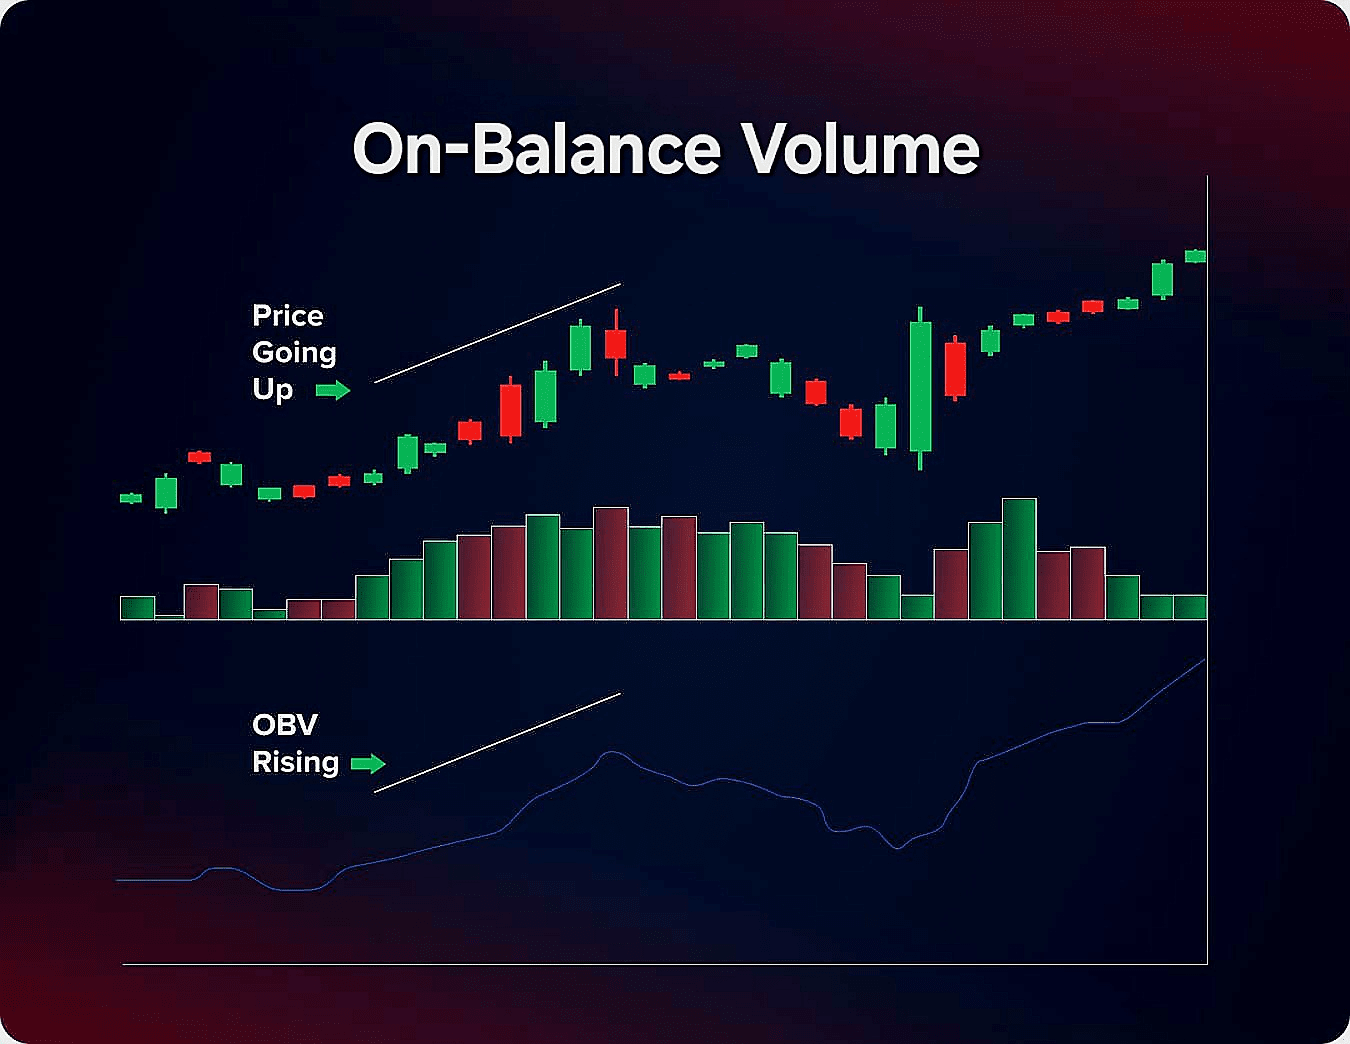
➡️ OBV uses volume changes to predict price moves, based on the idea that volume leads price.
⚙️How It Works:
✔️Cumulative Volume:
Adds volume on up days, subtracts on down days.
✔️Leading Indicator:
Volume shifts often precede price changes.
✔️Confirms Trends:
Divergence between OBV and price signals possible reversals.
🔍How Use It:
✔️Confirming Strength:
Rising OBV while price is flat or down suggests hidden buying pressure.
✔️Divergence Detection:
Falling OBV with flat or rising price warns of weakening strength.
✔️Volume Flow Timing:
Use OBV shifts to time entries alongside breakouts or breakdowns.
🎴Best For:
Traders who value volume to confirm price trends, especially swing and long-term traders.
🗝️Example:
Price hits new highs but OBV forms lower highs — a bearish divergence warning.
📌Remember:
OBV can mislead in choppy markets; always combine with other tools.
🏹 Final Word:
The market is a sea of chaos, but your tools are the stars that guide you. True mastery comes not from indicators alone, but from discipline and wisdom. Wield your knowledge, sharpen your skills, and write your own trading legacy.