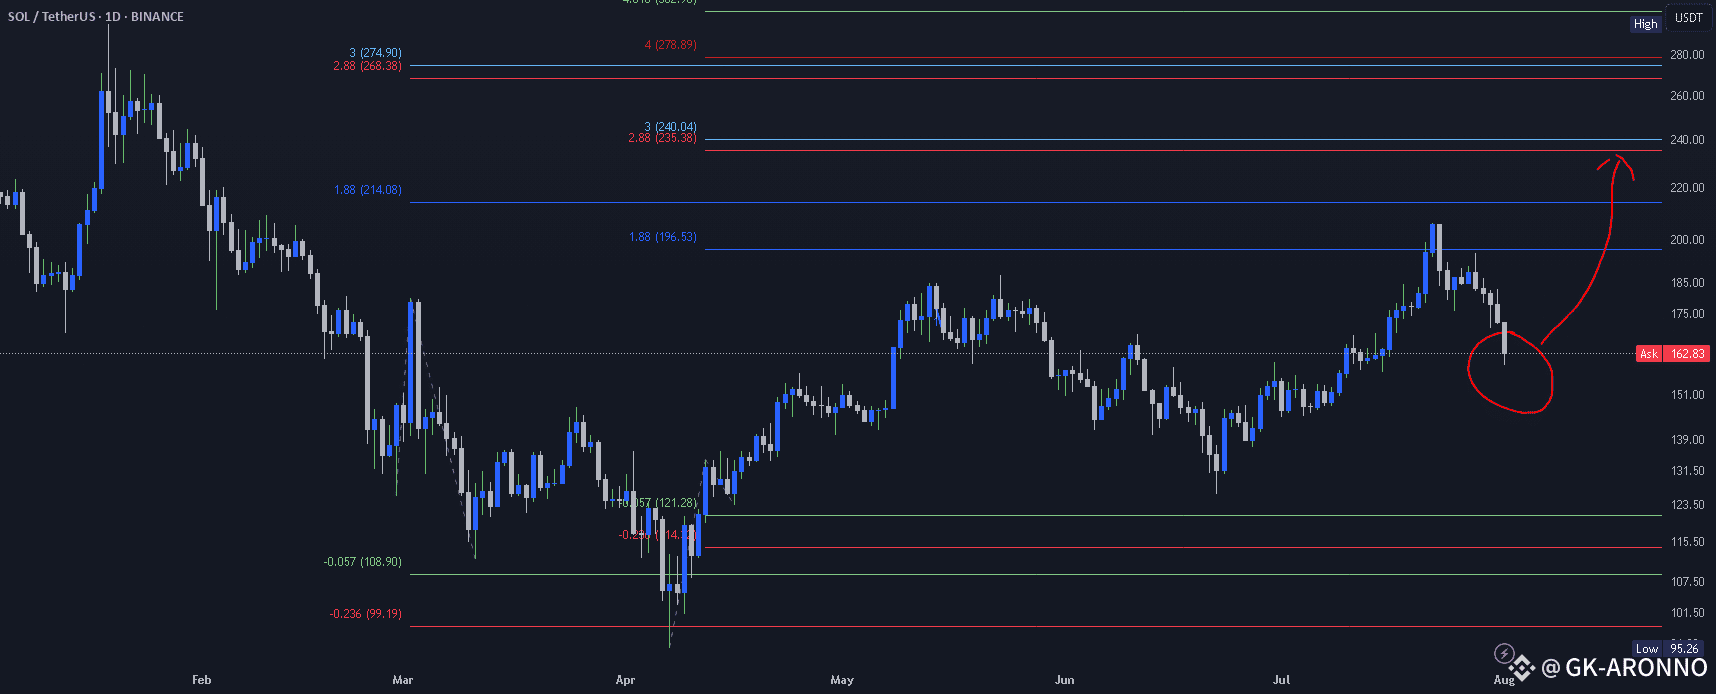
Key Insights:
Support Zone: Around $160–165, aligning with Ichimoku support lines.
Fibonacci Levels: Price broke above the 1.618 level (~$175) and is now retesting.
Indicators Below: Showing a strong bullish crossover, supporting upward momentum.
Target Path: Drawn to reach $223, then $240–260 if bullish trend continues.
📈 Bullish Scenario:
Bounce from $160–165 zone
-Short-term target: $195–200
-Mid-term target: $223
-Long-term: $240–260
📉 Bearish Scenario:
If $160 support breaks:
Next support levels: $145, then $122
Worst-case retest: $95
✅ Conclusion:
Crucial zone now: Either a strong bounce or a bearish breakdown.
Current indicators and structure favor a bullish continuation if support holds.
