

XRP's price is trading at $3.12 on July 31, 2025, achieving a market capitalization of $185.20 billion and recording a 24-hour trading volume of $5.3 billion. The day's price action saw XRP fluctuate between $3.04 and $3.17, attracting the attention of market participants as it oscillated near a key technical threshold.
XRP
On the 1-hour chart, XRP displays characteristics of a micro-consolidation phase after being rejected at $3.179. This led to five consecutive red candles, with minor recovery signs suggesting a potential short squeeze. Volatility is narrowing, often a sign of greater directional movement ahead. The technical pattern suggests the possibility of a bullish flag formation, dependent on the $3.12 support being held and a confirming breakout above $3.18. This level remains critical for traders anticipating a recovery towards higher resistance areas.
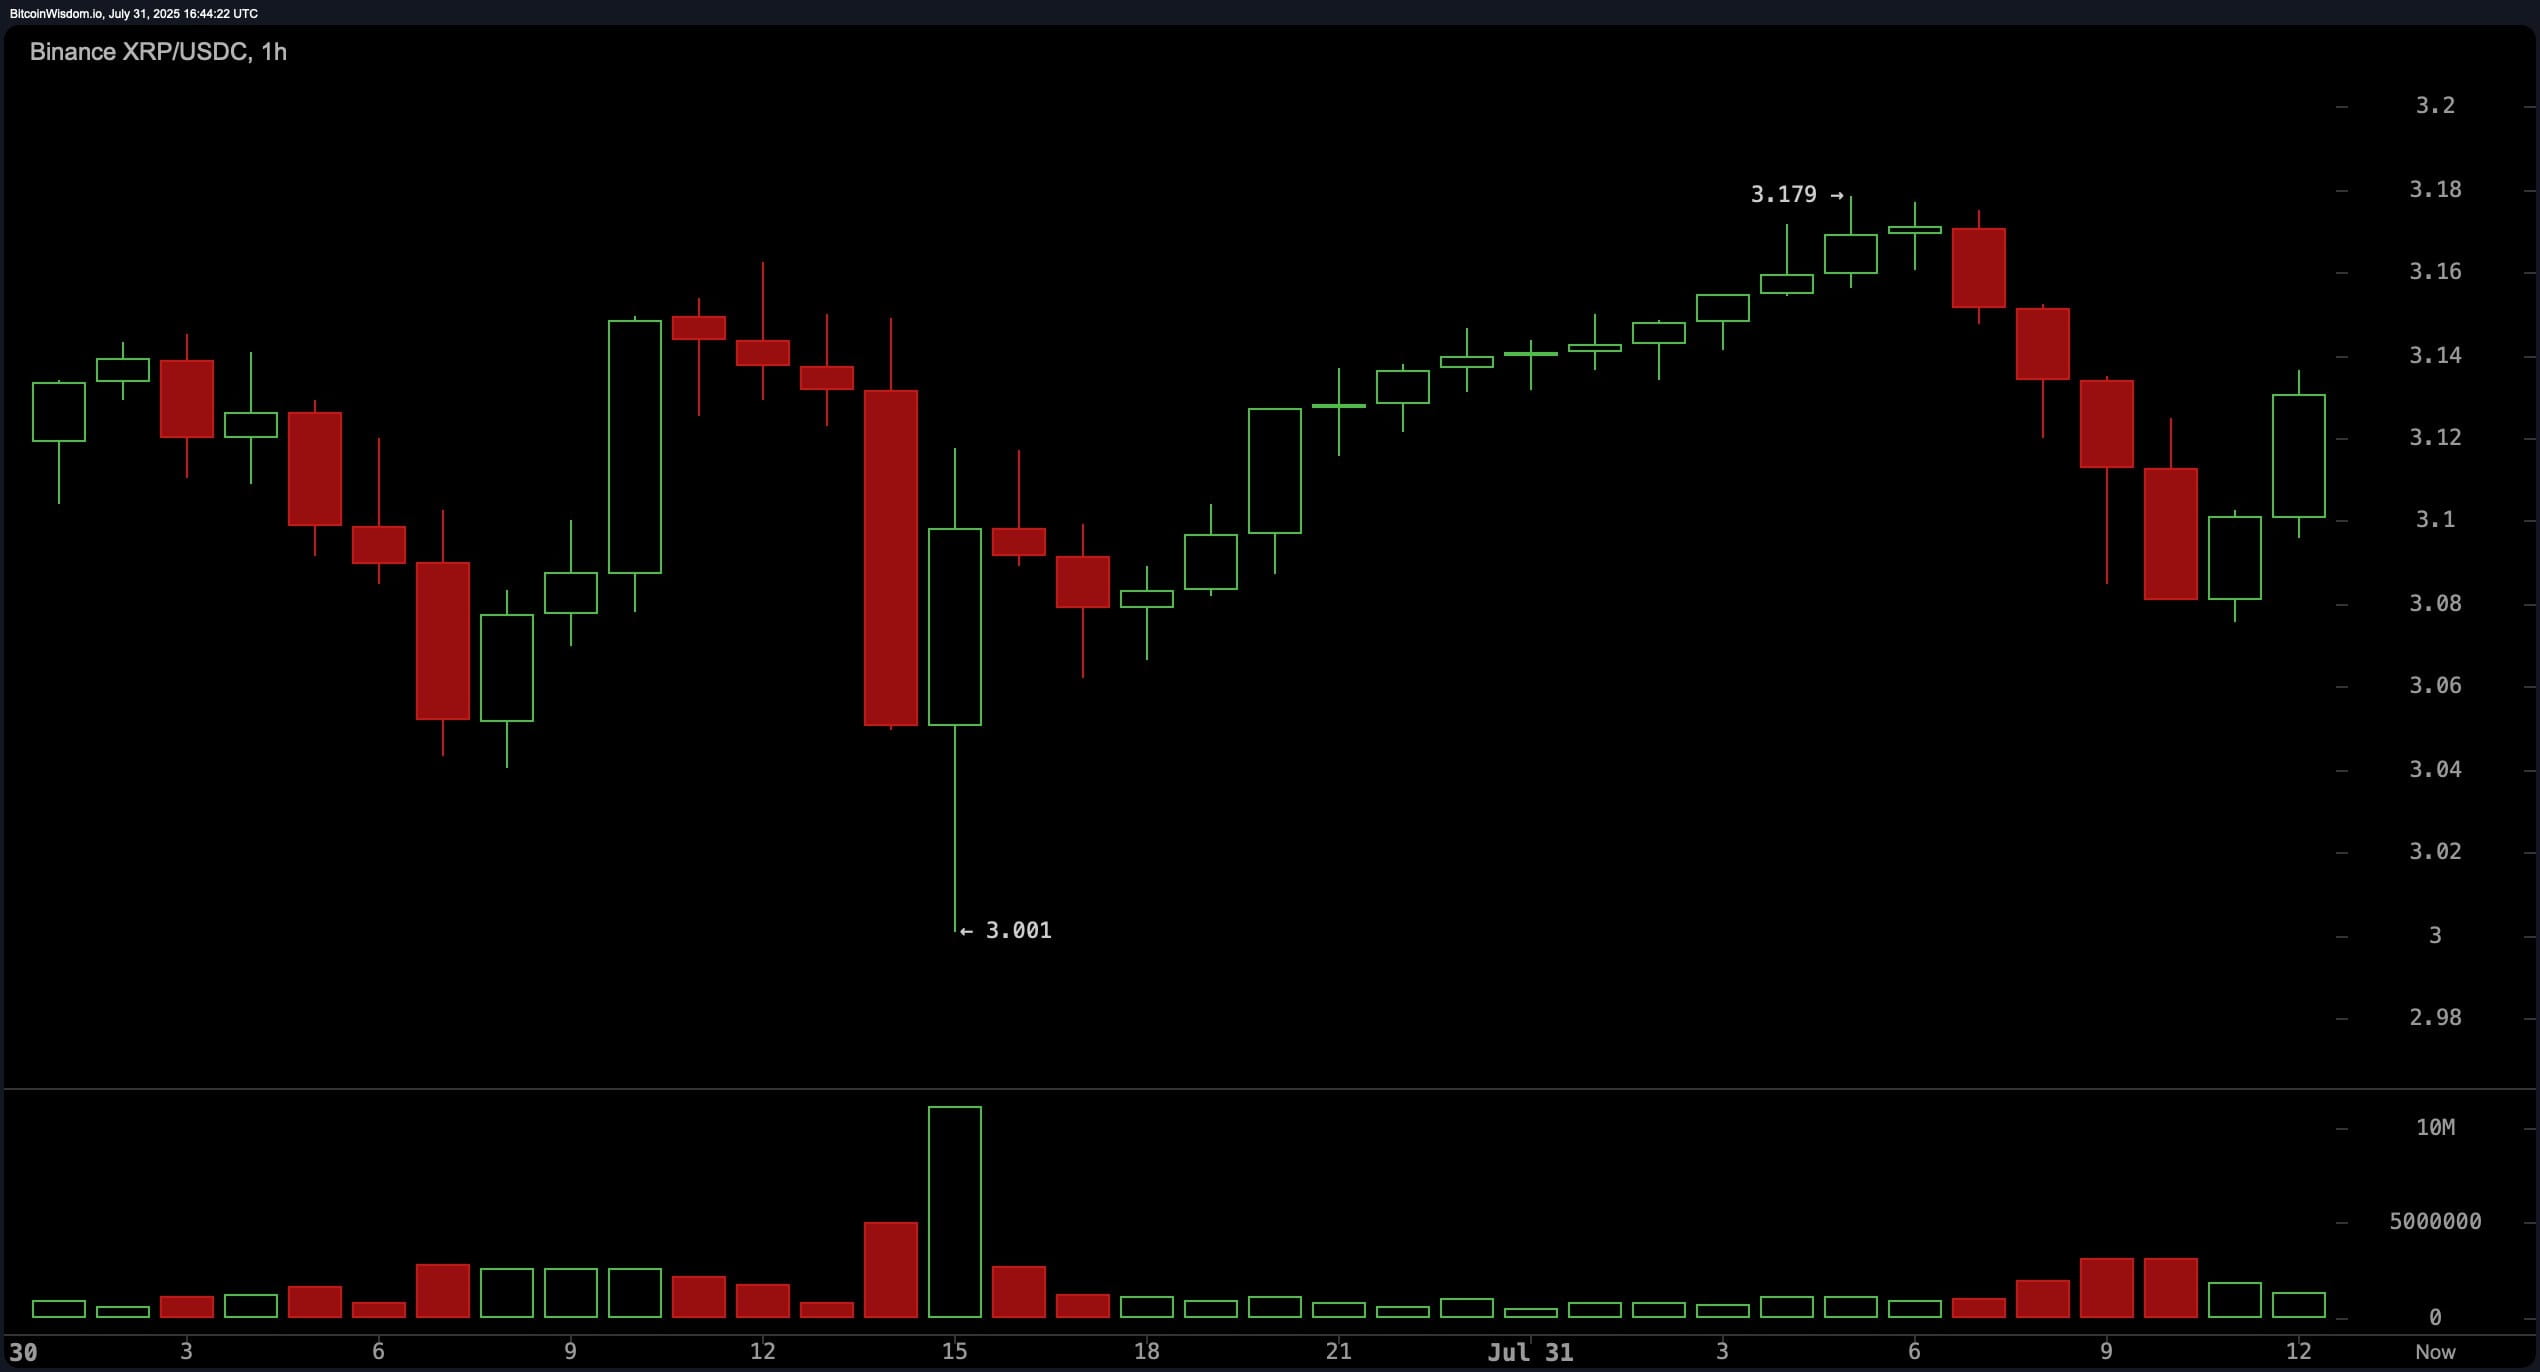
XRP/USDC on Binance's 1-hour chart as of July 31, 2025.
The 4-hour chart reinforces the trend from bearish to neutral, reflecting a series of lower highs and lower lows since the recent peak at $3.332. A descending triangle is forming, with horizontal support consolidating around $3.00 while resistance trends downward. Notably, selling volume has surpassed buying, highlighting the current bearish trend. Although $3.00 has held firm twice, the lack of a follow-through higher raises questions about bullish momentum. Failing to decide to break above $3.20 could lead to a retest of the $3.00 support level.
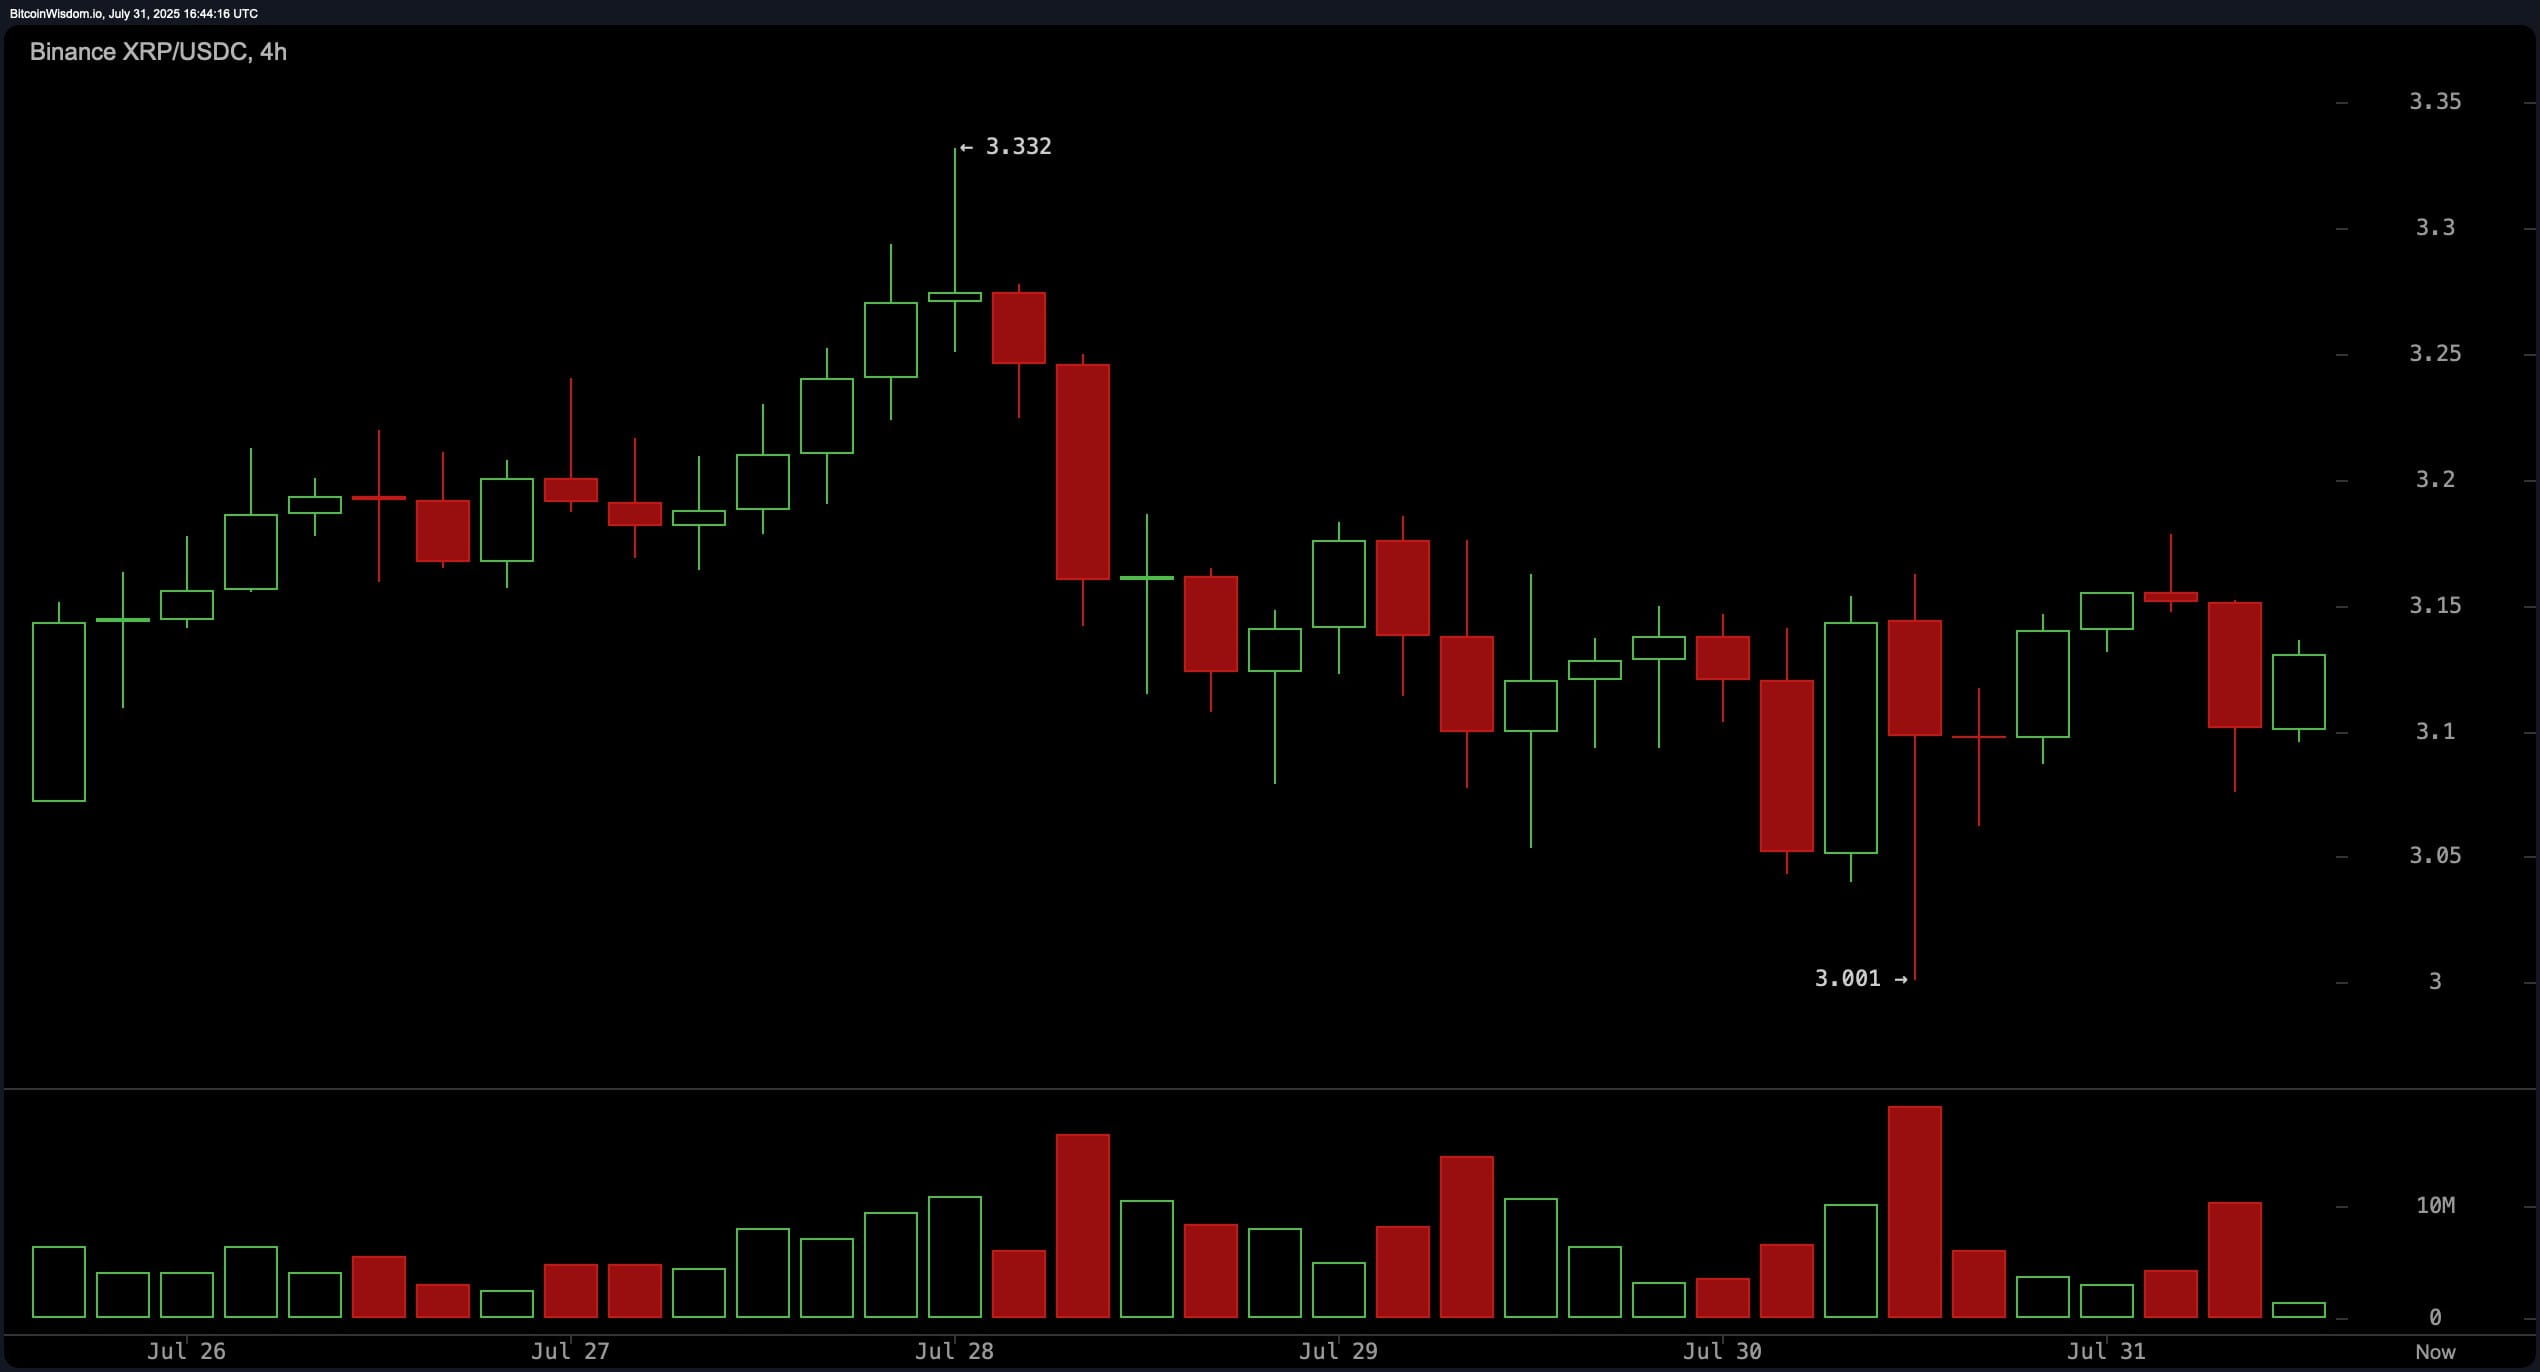
XRP/USDC on Binance's 4-hour chart as of July 31, 2025.
On the daily chart, XRP experienced a strong rally from around $2.07 to $3.66 before encountering strong resistance and a subsequent pullback. The current consolidation around $3.10–$3.20 indicates a potential distribution phase or the early stage of a trend reversal. The increase in volume at the peak and subsequent decline in momentum align with this narrative. Technically, forming lower highs poses additional downside risk unless the price breaks through the $3.40–$3.66 resistance area with significant volume. Currently, the short-term daily trend tends towards neutral to bearish.
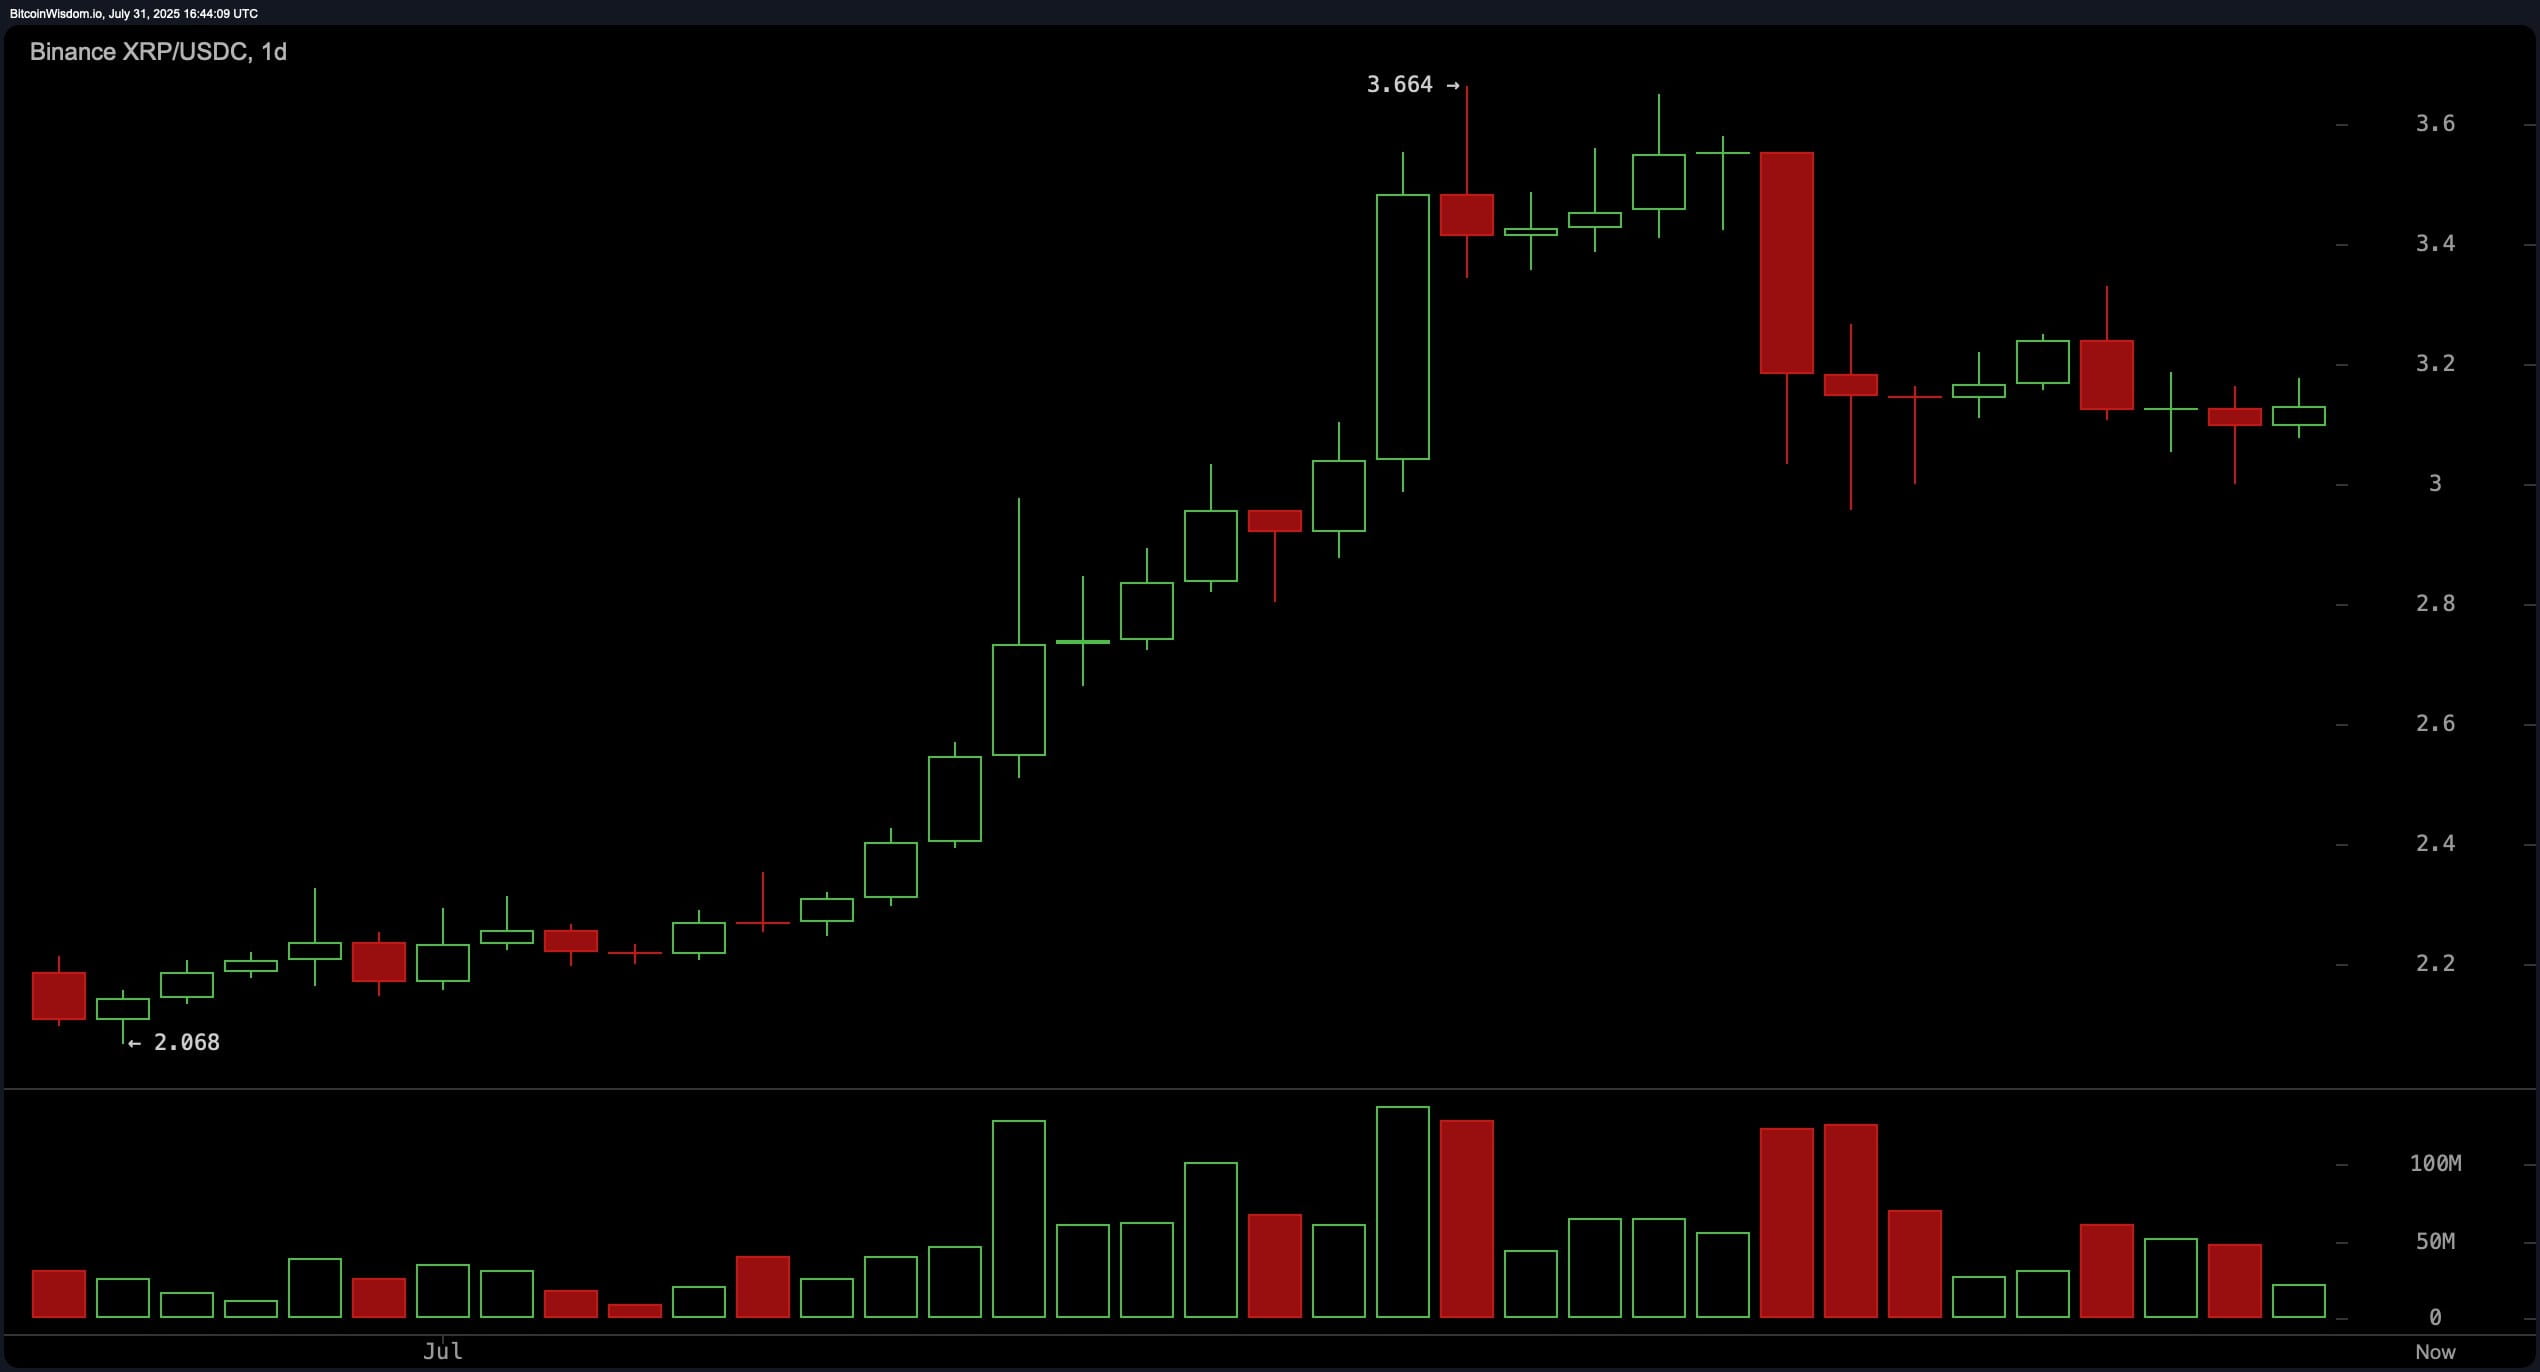
XRP/USDC on Binance's daily chart as of July 31, 2025.
The oscillator indicators present a mixed sentiment landscape. The relative strength index (RSI) at 57.65 reflects neutral momentum, while the stochastic oscillator indicates a modest oversold recovery at 25.30, also classified as neutral. The commodity channel index (CCI) at -17.82, and the average directional index (ADX) reaching 43.93 both indicate a lack of directional strength. The terrible indicator prints at 0.336, maintaining neutrality, but the momentum indicator records at -0.416, triggering a bearish signal. Meanwhile, the moving average convergence divergence (MACD) level of 0.1527 supports the bearish trend with a corresponding negative reading.
Moving averages (MAs) continue to confirm a bifurcated market structure. The 10-period exponential moving average (EMA) is at $3.1617 and the 10-period simple moving average (SMA) is at $3.1912, both generating bearish signals. However, medium and long-term indicators tend to be bullish, with the 20-, 30-, 50-, 100-, and 200-period EMAs and SMAs all indicating positive conditions. This includes the 50-period EMA at $2.7745 and the 200-period EMA at $2.3190. This divergence suggests a strong long-term bullish trend still exists despite short-term corrective pressure.
Bullish Verdict
XRP's long-term bullish structure remains intact, with a series of moving averages from medium to long-term confirming upward momentum. Despite short-term weakness and consolidation, the defense of key support levels near $3.00 and the potential breakout above $3.18 suggest bullish opportunities remain viable. Regaining the $3.40 level with volume could restart the bullish rally.
Bearish Verdict
The technical landscape reveals increasing short-term pressure, evidenced by descending triangles, stagnation of recovery, and several oscillators displaying bearish signals. Without a decisive breakout above $3.20, XRP risks further decline towards or below the $3.00 support area. Bearish momentum and MACD signals reinforce a cautious stance in the short term.
