🧠 Introduction:
In ICT methodology, market analysis is not only about "where" price is, but also about "when" it moves.
Smart money doesn’t act randomly—they operate during specific times of the day, leaving behind repeatable footprints.
By understanding time-based models and Killzones, traders can identify the best times to enter and exit, and when liquidity is real or false.
⏰ First: Time-Based Models:
What are they?
They are behavioral patterns that occur consistently at specific times of the day or week. These models reflect how institutional players operate and shift liquidity.
Key Models:
Asian Range:
From midnight to London open.
Price is often in consolidation; the highs and lows serve as liquidity targets later in the day.
London Open:
The first major move of the day usually begins here.
Helps establish the directional bias.
New York Open:
The most critical session, where aggressive moves happen toward liquidity objectives.
Midweek Reversal:
Frequently, the weekly trend reverses on Wednesday, especially after taking out the weekly high or low.
🎯 Second: Killzones (High-Probability Time Windows)
What are Killzones?
These are specific periods during the day when liquidity surges and smart money typically executes large moves. They are essential for timing high-probability setups.
Main ICT Killzones:
1. London Killzone:
08:00 to 11:00 (Algeria Time)
Price usually breaks out of the Asian range here.
2. New York Killzone:
13:00 to 16:00 (Algeria Time)
This is when the true daily move often begins, with clear MSS or liquidity runs.
3. Lunch Hour (Avoid Trading):
17:30 to 19:00 (Algeria Time)
Liquidity drops; manipulative moves may occur.
4. Asian Killzone:
01:00 to 04:00 (Algeria Time)
Mostly useful to mark the consolidation range.
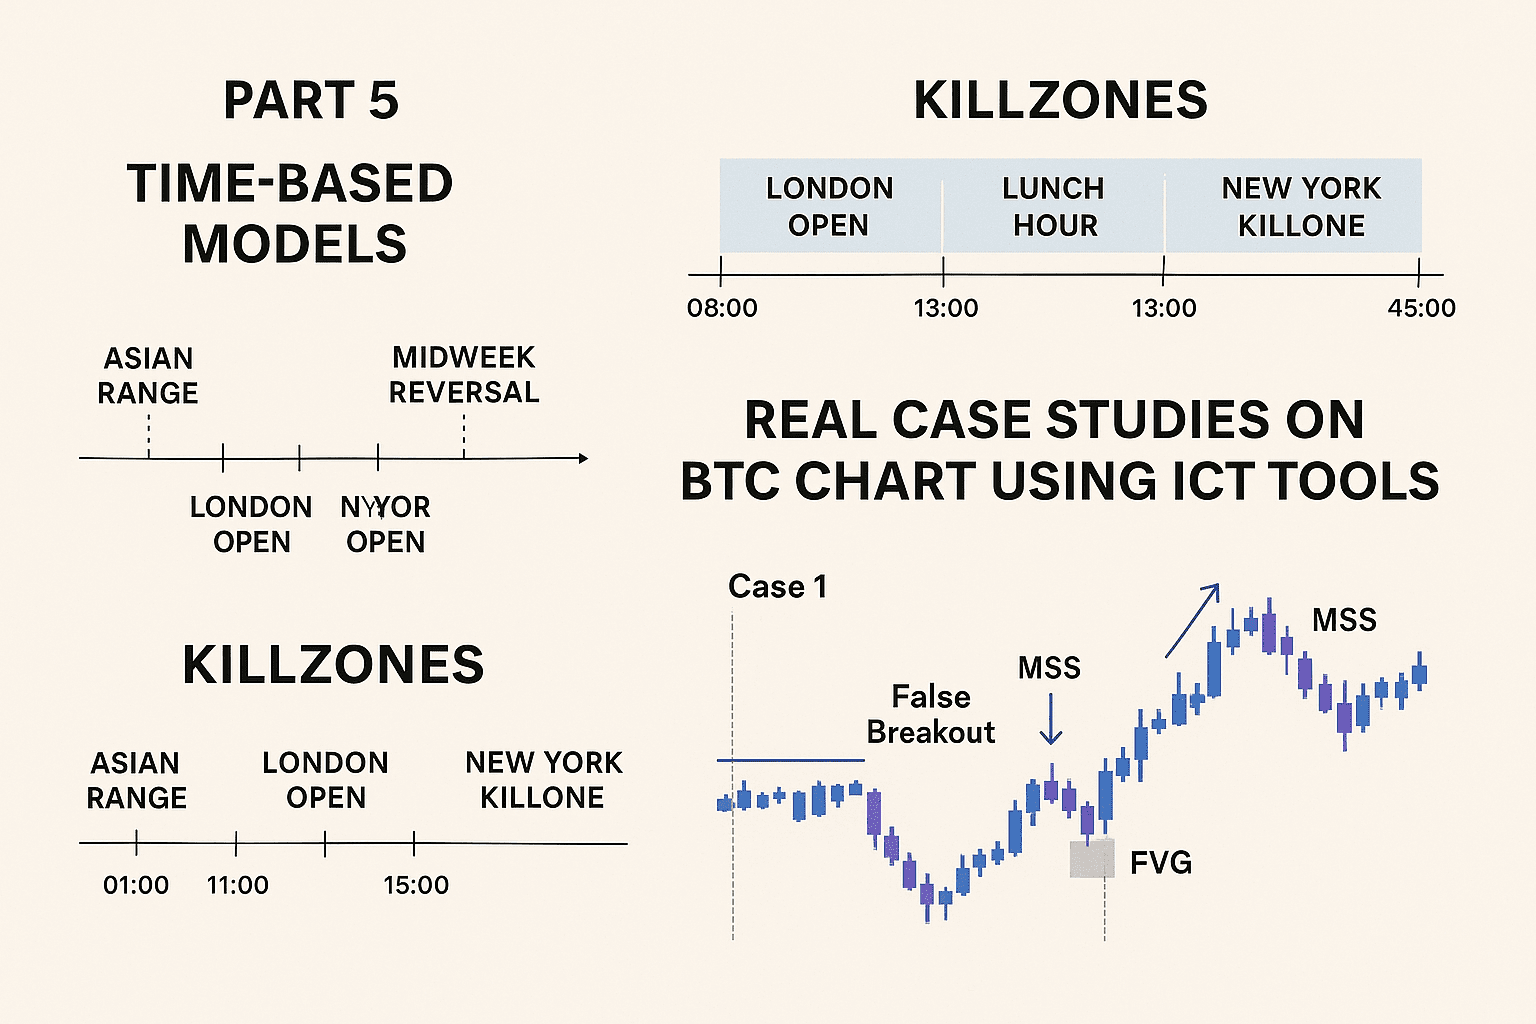
📊 Third: Real Case Studies on BTC Chart Using ICT Tools:
🟠 Case 1: London + New York Killzones + FVG + MSS:
Timeframe: 15 minutes
Day: Tuesday
1. Price consolidates during Asian session between 29,800 and 30,100.
2. At 08:30 (London Killzone):
The low at 29,800 is broken with a strong bearish Marubozu candle
False breakout confirmed by a bullish Hammer candle
3. At 13:00 (New York Killzone):
A bullish MSS forms after breaking a previous high
An FVG appears on the 5-minute chart around 29,850
4. Entry is taken from the FVG.
🎯 Result: Price rallies to 30,400 → Gain of +550 points.
🟠 Case 2: Midweek Reversal + Break + MSS:
Timeframe: 1 hour
Day: Wednesday
1. BTC in a strong uptrend since the start of the week.
2. At 14:00 (New York Killzone):
The weekly high at 31,800 is taken with a strong bullish candle.
Immediately followed by a Shooting Star then a bearish Engulfing candle.
3. A bearish MSS forms after breaking the low at 31,400.
4. Entry taken from a nearby FVG.
🎯 Result: Price drops to 30,600 → Gain of +1,200 points
🧠 Conclusion:
Markets don’t move randomly—they follow precise time-based behaviors.
Killzones are your golden windows to capture institutional moves.
Combining Time + Price + ICT Tools (FVG, MSS, etc.) gives you an advanced trading edge.
Even BTC, as a digital asset, reacts beautifully to ICT’s time and liquidity concepts.