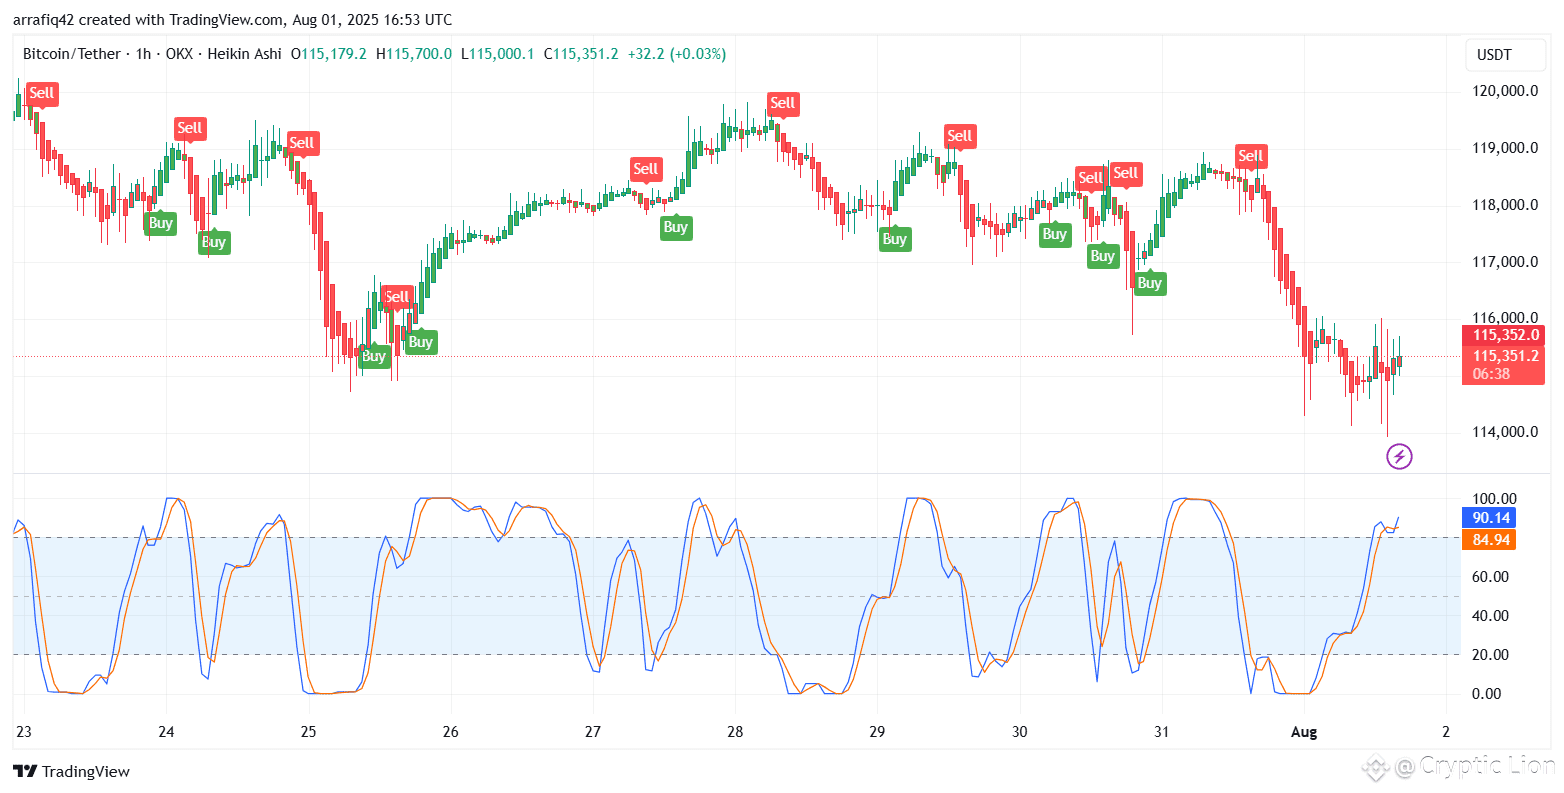
As of August 1, 2025, Bitcoin (BTC) against Tether (USDT) on the 1-hour Heikin Ashi chart presents a volatile yet pattern-driven picture for short-term traders. The BTC price currently hovers around $115,351, slightly up by +0.03%, indicating consolidation following a steep decline.
Market Sentiment and Price Action
The chart is populated with a series of "Buy" and "Sell" signals—automated trading indicators that suggest optimal entry and exit points. A quick scan shows:
Frequent Sell signals above $118,000 across July 29–31, marking short-lived rallies.
Buy signals emerging post-dip in the $114,000–$116,000 range.
Notable Sell clusters were followed by sharp declines, especially before July 25 and July 31.
The Heikin Ashi candles visually confirm trend direction. Strong red candles signal bearish momentum, particularly evident from July 30 into August. Conversely, the green candle clusters around July 26 and 29 indicate temporary bullish recoveries.
Stochastic Oscillator Analysis
Beneath the price chart, the Stochastic Oscillator reflects market momentum and potential reversal zones:
Overbought (>80): The current Stochastic value is around 90.14 (blue line) and 84.94 (orange line)—signaling overbought conditions.
Historically, each time the indicator hit similar highs (above 80), a downtrend soon followed.
Conversely, dips below 20 often preceded rallies, as seen around July 25 and 31.
This suggests a potential short-term correction is looming unless the momentum is sustained by increased buying pressure.
Key Observations
Resistance Levels: $118,000 to $119,000 has been tested multiple times but rejected, suggesting strong seller interest.
Support Zone: $114,000 appears to be a crucial floor, with multiple "Buy" triggers seen near this region.
Trend Outlook: The overall chart shows a choppy sideways market with slight bearish inclination recently.
Trading Strategy Recommendations
1. Short-Term Traders: Watch for a bearish crossover on the Stochastic Oscillator while near resistance zones to consider shorting opportunities.
2. Scalping Approach: Capitalize on "Buy" signals near $114K–$115K zones and "Sell" signals near $118K until a breakout emerges.
3. Risk Management: Given high volatility, tight stop-loss orders are advised. RSI or volume confirmation may be added for better accuracy.
Conclusion
Bitcoin’s current chart structure signals caution for bulls as overbought indicators emerge amidst resistance. However, traders employing signal-based scalping strategies have opportunities in both directions. If BTC breaks above $119K convincingly, we may enter a new leg upward. Otherwise, consolidation or a dip toward $114K support is likely.
📉 Stay alert, trade smart, and watch for the next Stochastic reversal.
#Bitcoin #CryptoAnalysis #BTCUSDT #TradingSignals #HeikinAshi #StochasticOscillator #CryptoNews #BinanceWrite2Earn
