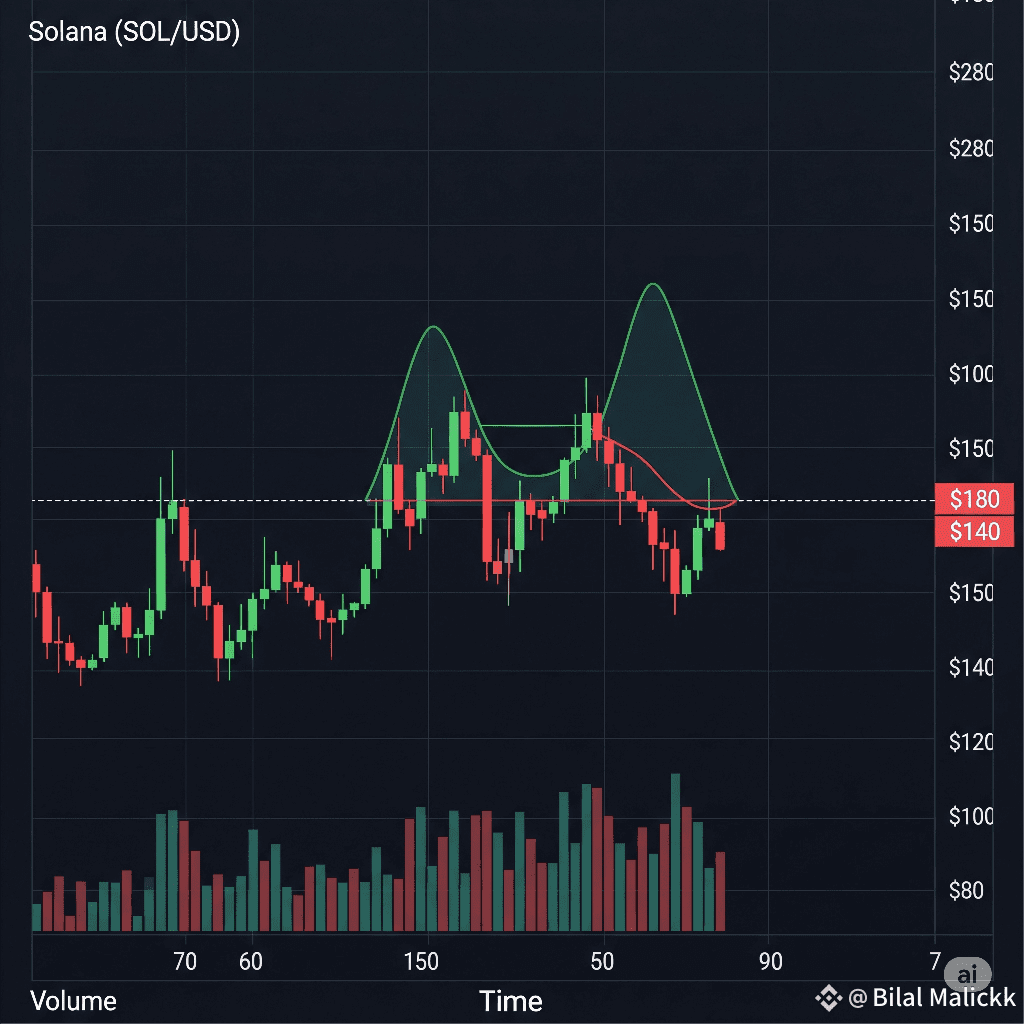
Solana ($SOL ) is flashing a major warning sign: a double top pattern has formed on the chart, a classic bearish indicator that often precedes a significant price correction 📉.
This pattern, which looks like an "M" shape, was created after the price was rejected twice at a key resistance level 🧱. Adding to this bearish outlook, technical indicators are also turning red 🚨. The Relative Strength Index (RSI) is flattening, and the Moving Average Convergence Divergence (MACD) has just seen a bearish crossover 🔁. This suggests that buying momentum is fading and sellers are gaining control 🐻.
On-chain data reinforces this view. A growing number of $SOL tokens are being moved to centralized exchanges 🏦, a move that often precedes a sell-off. At the same time, large holders, or whales 🐋, are beginning to reduce their positions. This combination of rising exchange balances and whale selling indicates that a major correction could be on the horizon 💥.
Social sentiment is also shifting. The market narrative is turning from bullish to cautious, with many traders discussing the potential for a "rugwave correction" 🌊. Even in the NFT space, which has been a strong driver of Solana activity, traders are waiting for a better reentry point 🛑, signaling a broader loss of confidence in the short term.
It's important to remember that this doesn't mean SOL's long-term potential is gone. However, in the short term, the double top pattern signals a strong need for caution 🧠. If a key support level breaks, we could see a rapid price drop as retail traders exit and whales offload their positions 💣🏃♂️.
With that in mind, it's wise to manage your risk carefully and avoid blindly chasing green candles 🕯️❌. Pay close attention to the key breakdown zone, and be prepared for increased volatility 📊.
Disclaimer: This is not financial advice ⚠️. Always do your own research 📚.