Success is by no means accidental; every successful person has gone through numerous hardships and walked step by step to get there. It cannot be denied that some people are born geniuses, but such people are few and far between; neither you nor I are. Most people, after continually experiencing failures, gradually become perfect. It is these experiences of failure that lead to insights that shortcuts cannot provide.
A common saying is that there are no good opportunities; in fact, opportunities come to those who are prepared. When the opportunity arises, you must be ready to seize it. Waiting idly is like waiting for a rabbit to come to your doorstep; when the opportunity truly presents itself, you either miss it or cannot seize it.
In the coin circle, many friends may not know how to read candlestick trading strategies, and those who understand are few and far between. It's often said that mastering one technique allows you to eat well everywhere; mastering a technique that you can understand isn't difficult, but the challenge lies in not wanting to learn or being unwilling to learn. Trading coins isn't for others, but for yourself. If you're willing to put in the effort to learn and master it, trading coins won't be as difficult as you think.
In addition to solid techniques, I also strictly adhere to the following 8 ironclad rules.
1. A sharp drop is a touchstone for quality coins. If the market drops sharply and your coin only dips slightly, it is clear that the market maker is protecting the price, refusing to fall. Therefore, such coins can be held with confidence; there will be returns.
2. Once a major upward wave is formed without significant volume increase, intervene decisively; hold coins when volume rises, and hold coins when volume falls but the trend isn't broken. If a volume drop breaks the trend, quickly reduce your holdings.
3. After a short-term buy, if there is no fluctuation for three days, take profit if possible. If it drops after buying, unconditionally stop loss at a 5% loss.
4. If a coin falls 50% from a high and continues to fall for 8 days, it has entered an oversold channel, and an oversold rebound is imminent, you can follow up.
5. When trading coins, focus on the leaders; only trade leaders, not miscellaneous coins. Because when they rise, leading coins rise the most, and when they fall, they resist falling the most. Don't be afraid to get in; trading coins is often counter-intuitive. Don't buy just because prices have fallen significantly, and don't avoid buying just because prices have risen significantly. The more you hesitate to buy, the more they rise, and the more you dare to buy, the more they fall. The strong remain strong; in short-term trading of leaders, the most important thing is to buy at high positions and sell at even higher positions!
6. Embrace the trend, go with the flow. The buying price isn't necessarily better the lower it is, but rather the more suitable it is. You won't gain an advantage simply because you bought at a low price, because falling prices don't signal a bottom. Abandon junk coins; trend is king.
7. Don't let the excitement of profits cloud your judgment. Understand that the hardest thing in the world is how to sustain profits. You must seriously review whether it was luck or skill; a stable trading system that suits you is the way to sustained profits.
8. Don't trade just for the sake of trading. What does this mean? It means that when you don't have enough confidence that this trade will be profitable, don't force yourself to open a position. Staying in cash is an art; those who can buy are apprentices, those who can sell are masters, and those who can stay in cash are the ancestors. In trading, the first consideration isn't profit, but capital preservation. What matters in trading isn't frequency, but the success rate!
So how can we do well in trading coins? Once a person enters the financial market, it's hard to turn back. If you are currently at a loss yet still confused, and plan to take coin trading as a second career in the future, you must understand the 'MACD indicator techniques.' Understanding it thoroughly can help you avoid many detours; these are personal experiences and insights, so it's recommended to save and review them repeatedly!
The MACD indicator is the most classic technical indicator among all technical indicators. Proper use of this indicator, in conjunction with candlesticks (daily, weekly), individual stock trends, volume, market trends, and news, can generally yield good buying and selling results. Below, I will share the most comprehensive use of the MACD indicator; those who can truly understand it are experts!
1. Explanation of MACD Indicator
1. Concept Definition
MACD (Moving Average Convergence Divergence) describes the relationship between two moving averages, including a fast line and a slow line. Its main function is to judge and predict changes or continuations in price trends.
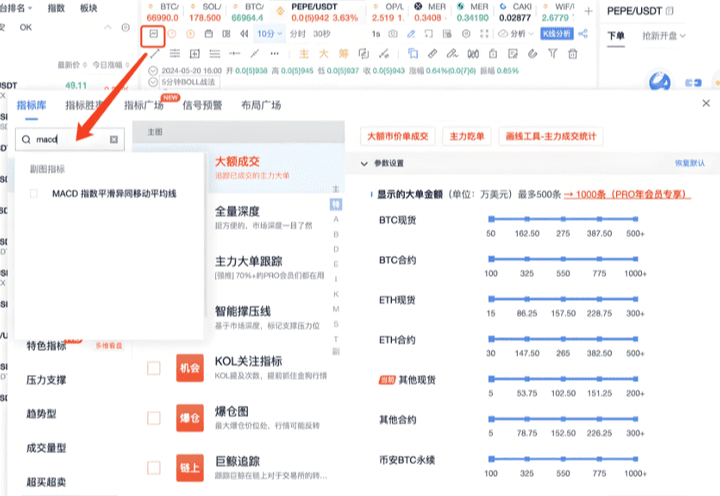
2. How to enable the MACD indicator
Open the indicators library, search for the MACD indicator and check it. The MACD indicator will show below. Taking BTC/USDT trading on Binance as an example, when the price is 66997.99, switch to the BTC 1-hour chart, set MACD's call 1 to spot. In the original parameter settings, the short period (N1) is 12, the long period (N2) is 26, and the DEA period (M) is 9. You can use the original settings without making excessive changes.
3. Green Line and Orange Line
1. Green Line (DIF, Fast Line): This is the difference between the short-period (12-period) EMA and the long-period (26-period) EMA. It reacts sensitively to market changes and reflects market changes over a shorter time span.
2. Orange Line (DEA, Slow Line): This is the 9-period EMA of DIF, relatively smoother, reflecting market changes over a longer time span, and is lagging compared to the fast line.
3. MACD Energy Bars: Show the difference between DIF and DEA. Through the green line, orange line, and energy bars, you can judge market trends and momentum changes.
2. MACD Golden Cross and Death Cross Trading Strategy
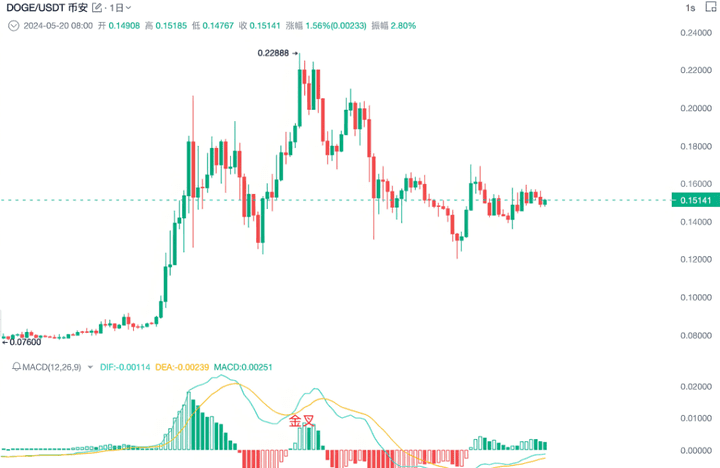
When the price is in a downward trend, the fast line crosses up through the slow line, forming a golden cross, which means the trend may change from downward to upward, presenting a buying opportunity.
When the price is in an upward trend, the fast line crosses down through the slow line, forming a death cross, indicating that the trend may change from upward to downward, which is a reasonable short entry point.
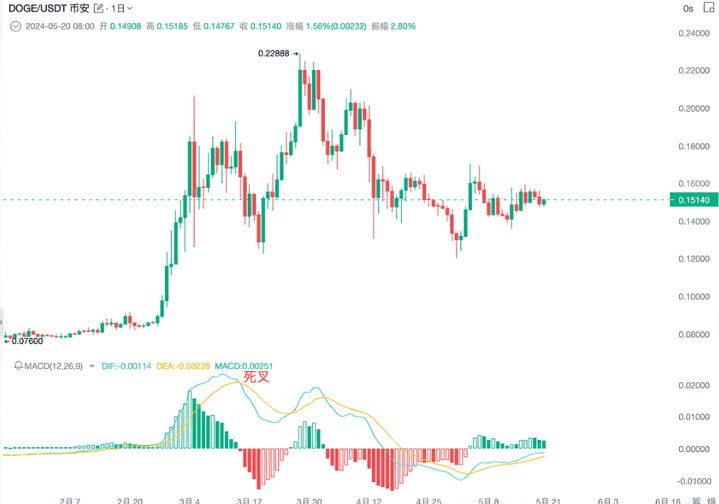
This is the traditional use of the MACD.
3. MACD Divergence Trading Strategy
1. MACD Top Divergence
When the price's highs are higher than the previous high, this is peaks higher.
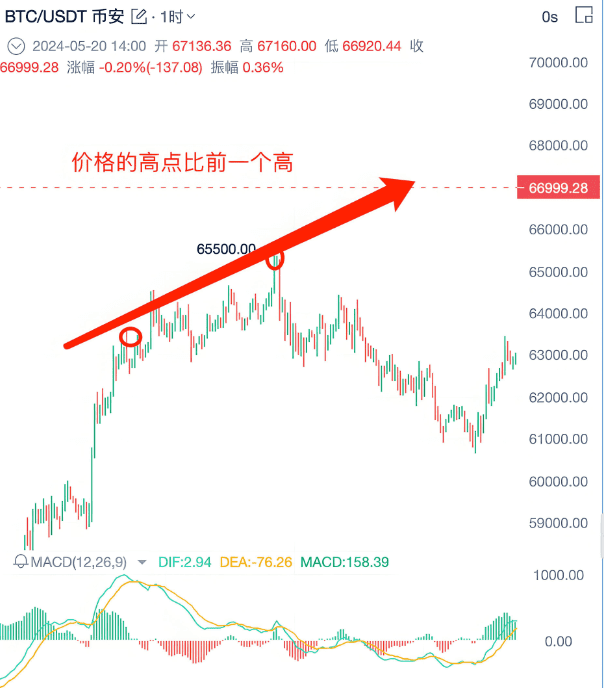
When the price's highs are higher than the previous highs, this forms peaks higher. Normally, MACD should also form peaks higher to match the price's trend momentum.
If MACD forms peaks lower at this point, it indicates signs of weakened price momentum.
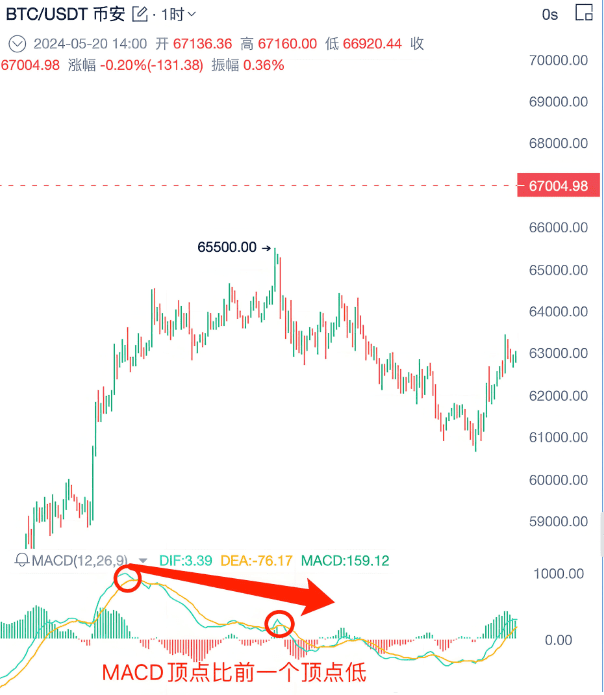
When the price forms peaks higher but MACD forms peaks lower, this is top divergence. At this point, the price trend is likely to shift downward.
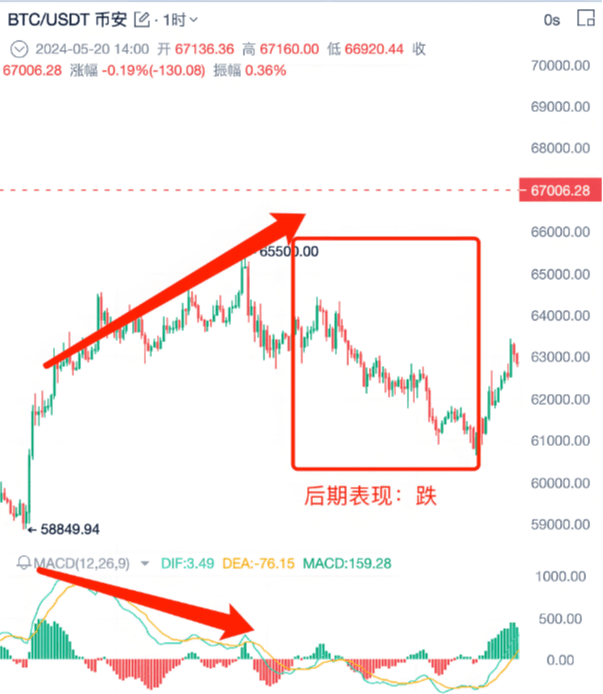
When confirming a trend, it is necessary to find key price levels and MACD trend reversal divergence.
2. MACD Bottom Divergence
The price's low is lower than the previous low, which is a bottom lower.
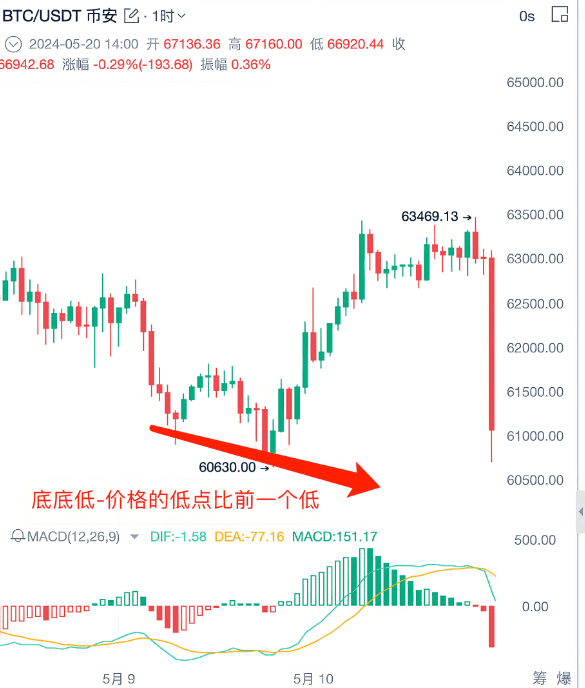
If MACD forms a bottom higher at this point, it means buying momentum begins to intervene, and the downward momentum of the price gradually weakens.
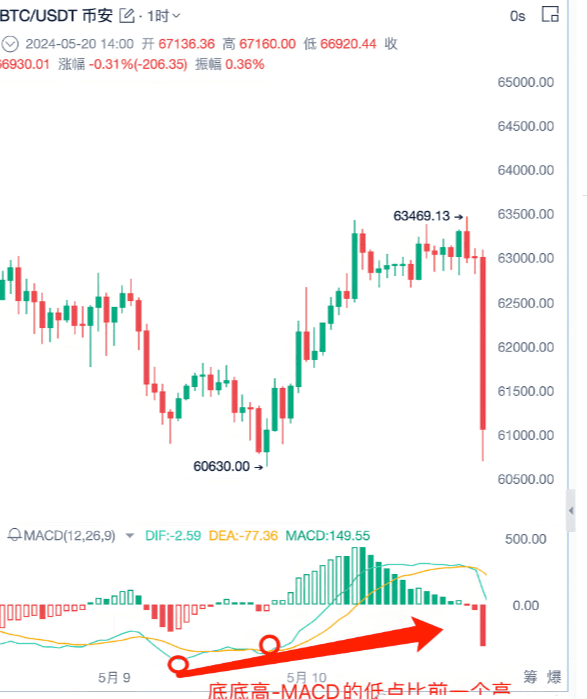
It is highly likely that the trend will change from a downward trend to an upward trend. When the price forms a bottom lower, but MACD forms a bottom higher, this is bottom divergence. When bottom divergence occurs, it means the trend is likely to change to an upward trend, which is a reasonable buying opportunity.
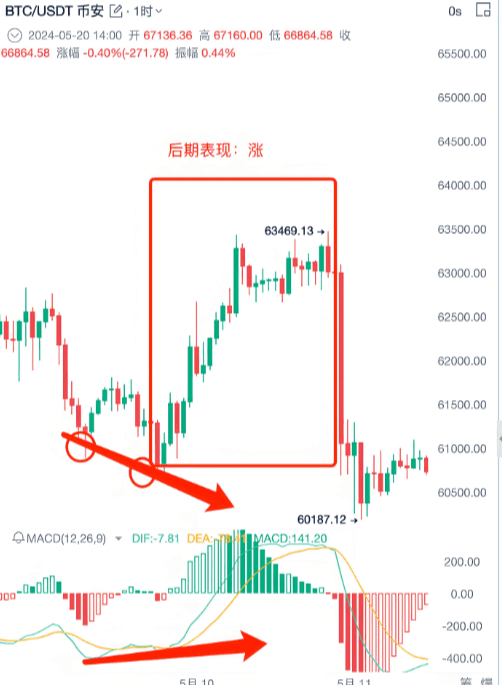
3. Trading Strategy for MACD Trend Reversal
Key price levels and MACD trend reversal divergence: Find two peaks and draw a line connecting them, and simultaneously find the corresponding two peaks at the bottom MACD. #Strategy Increase Bitcoin holdings
Judging key support levels: When the price tests a support level multiple times and then rises sharply, that support level is a key support level. When the price returns to the key support level, you can look for signals to go long.
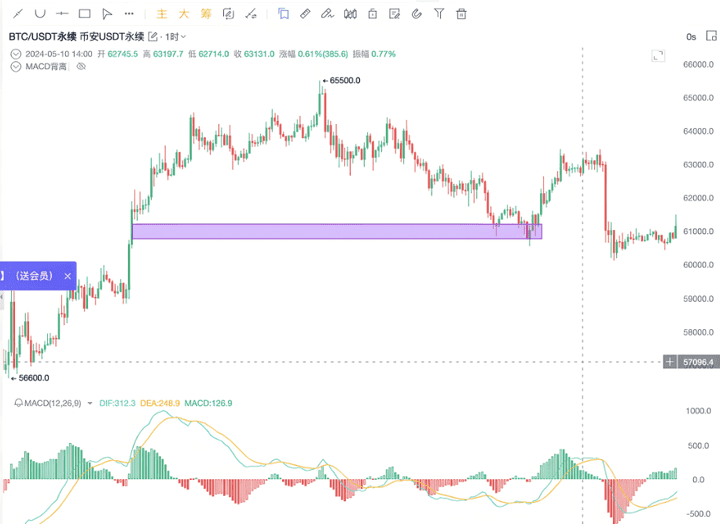
For example, we find a mountain peak that has gone through a round of ups and downs and has returned to a support level.
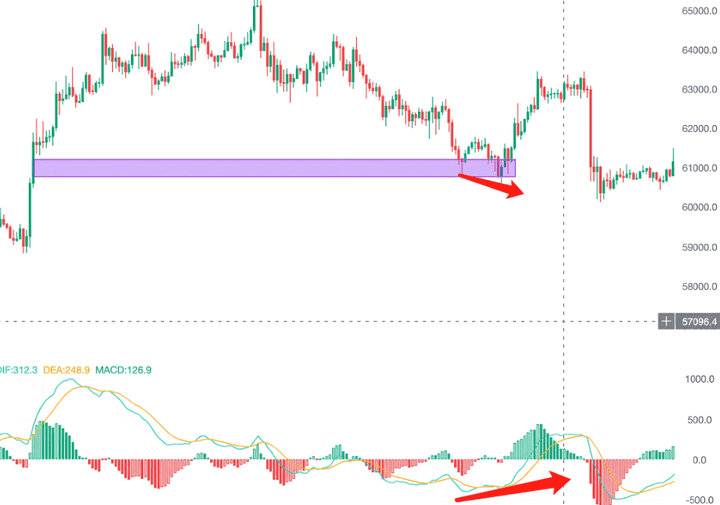
For example, when the price returns to a support level after a round of ups and downs, you still cannot directly go long; you need an additional signal to confirm that the bottom divergence is valid. You can draw a descending trend line, and if it forms a descending wedge triangle (a bullish chart pattern), when the price breaks through the descending wedge triangle, you can enter to go long.
You can see this is a descending wedge triangle, a bullish chart pattern. When the price breaks through this descending wedge triangle, we can enter to go long.
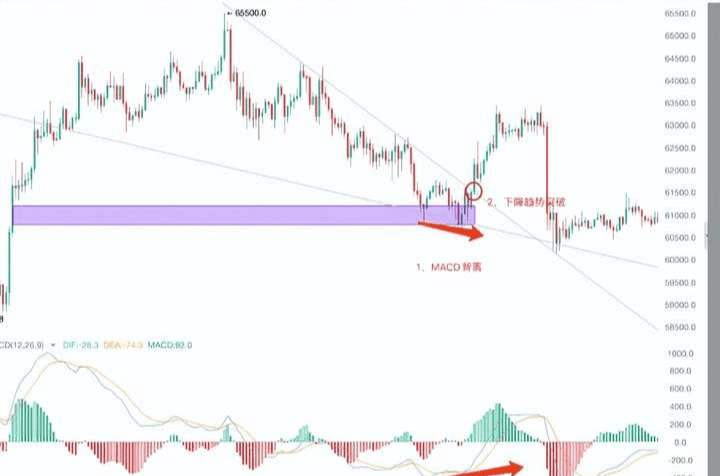
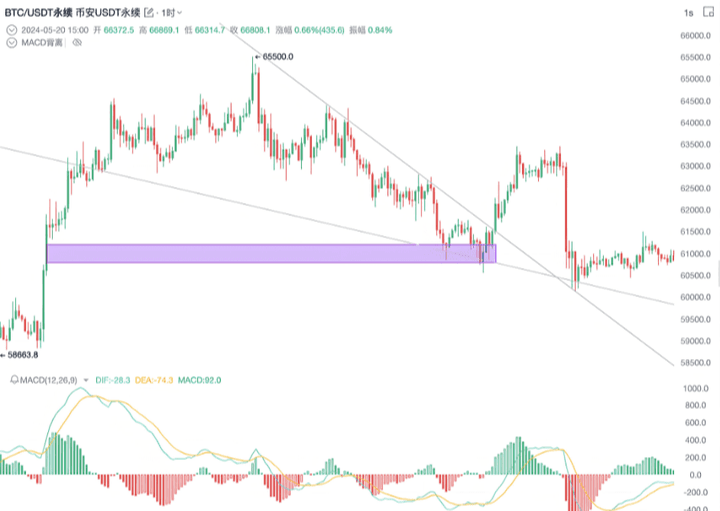
If these two points are met and the descending trend line is broken, you can consider going long. Draw a line at the previous high of the downtrend. When the price breaks through the previous high, it represents a trend break, and the price is likely to change from a downward trend to an upward trend. You can enter to go long after the price breaks the previous high. In summary, trading needs to combine key price levels and MACD trend reversal divergence. In short: Key Price Levels + MACD Trend Reversal Divergence.
4. How to find support levels?
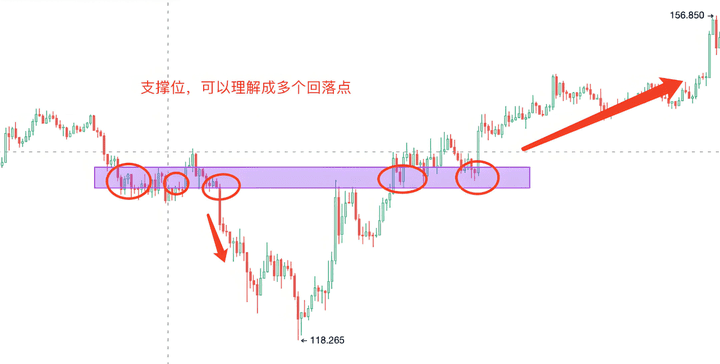
Support levels can be understood as multiple pullback points, which can form valleys or peaks. At the foot of the mountain, prices will often retest. Support can be a small range of price intervals or a specific point. Meanwhile, it is important to combine MACD divergence and key price levels to judge whether the support level has been broken.
The above is the most practical MACD trading strategy. These techniques can be applied in different markets, across different varieties, and different time frames, suitable for most traders to learn and use.
Lao Bo only does real trading, and the team still has positions to get in quickly.

