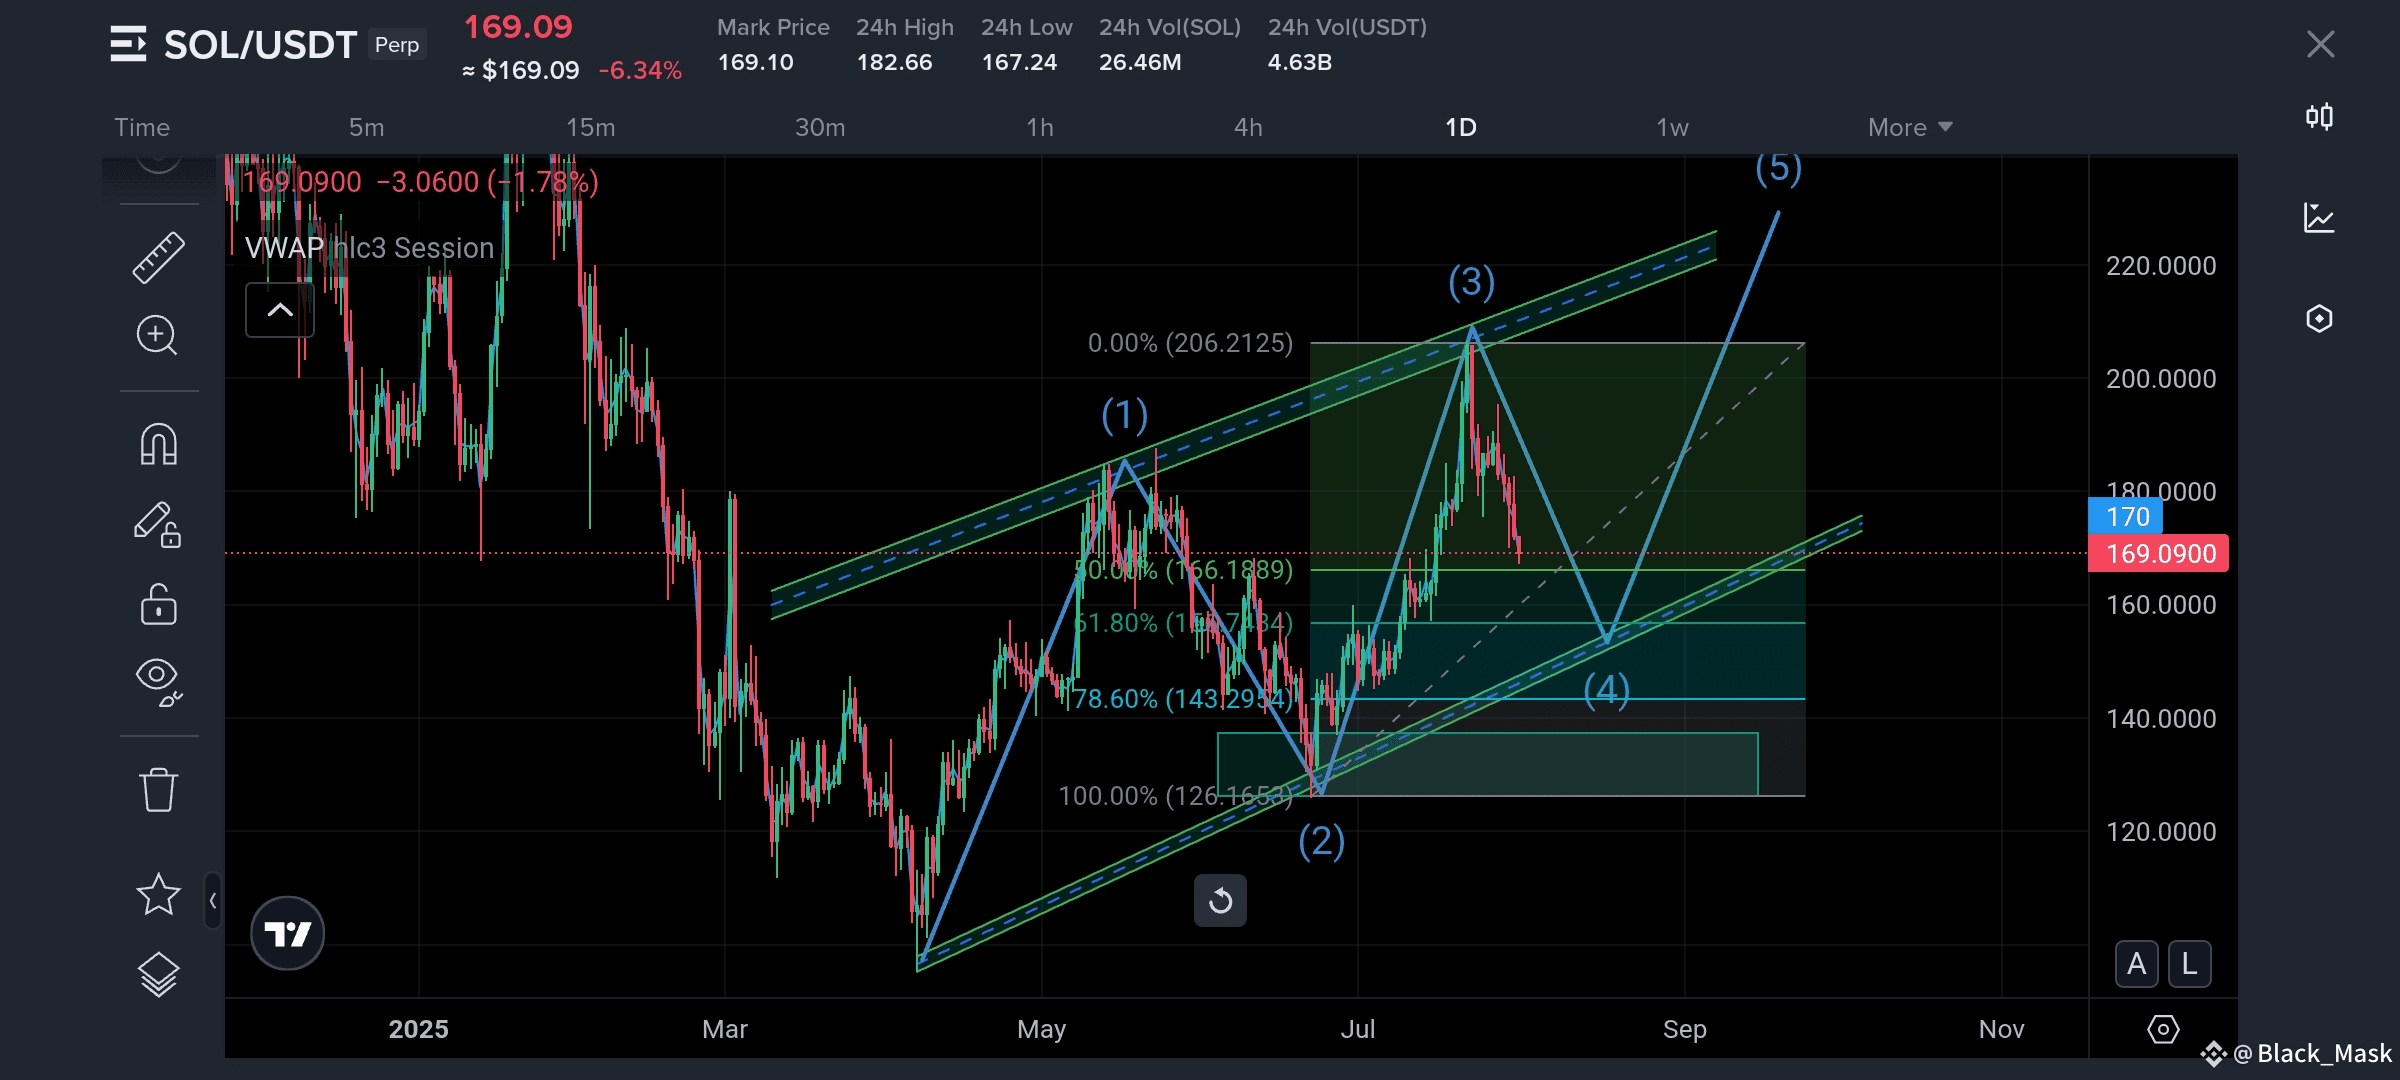
🧠 Chart Type:
Pair: SOL/USDT (Perpetual Futures)
Timeframe: 1D (1-Day candles)
Analysis Style: Elliott Wave + Fibonacci + Channel Pattern
---
📌 Main Structure Observed:
🔷 Elliott Wave Structure (Impulse Wave):
The chart follows a classic 5-wave impulse uptrend:
✅ Wave (1)
Starting point of the bullish trend (around late March).
Wave (1) peaked around early May.
It shows the first leg of the upward trend.
✅ Wave (2)
Retracement from the Wave (1) peak.
Ended around $126.16, touching the 100% Fibonacci extension level from the previous wave.
✅ Wave (3)
Strong bullish impulse wave.
Peaked at $206.21 (0.00% retracement).
This is often the strongest wave in Elliott Wave theory.
🟡 Wave (4) (Now in progress)
Current correction wave, retracing back into the Fib golden zone (50%–78.6%).
Price currently near $169.09 (within expected retracement area).
Likely bottom between $143.29 and $160 (strong support zone).
🔵 Wave (5) (Yet to happen)
Projected bullish breakout after correction completes.
Possible target range: $220–$230 or higher.
This wave might break previous resistance and hit the top of the bullish channel.
---
📐 Fibonacci Retracement Levels:
These levels are measured from the bottom of Wave (2) to the top of Wave (3):
Fibonacci Level Price Area Significance
0.0% $206.21 Top of Wave (3)
38.2% $181.84 Minor support
50.0% $166.18 Golden retracement zone
61.8% $151.84 Golden ratio buy zone
78.6% $143.29 Last retracement support
100.0% $126.16 Wave (2) low – trend invalidation
---
🟢 Channel Pattern:
Price action is moving within an upward-sloping parallel channel.
Wave (3) touched the upper boundary, and Wave (4) is now touching the midline/lower band.
Suggests potential for another upward move toward the upper channel.
---
📊 Support & Resistance Zones:
Type Price Level Notes
Immediate Support $166–$160 50% Fibonacci level
Strong Support $151.84 61.8% Fib (reversal zone)
Final Support $143.29 78.6% Fib; critical support
Resistance $182 Short-term resistance
Major Resistance $206.21 Wave (3) top
Final Target $220–$230 Wave (5) projection based on trend
---
🧾 Trading Strategy Idea:
🔹 Buy Zone (Entry):
Between $151 to $160 (if price confirms support)
Look for reversal candle patterns or bullish divergence.
🔹 Stop Loss (SL):
Below $143
(Break below 78.6% invalidates Wave 4 correction and risks bearish reversal)
🔹 Target (TP):
First TP: $182 (resistance area)
Second TP: $206 (Wave 3 top)
Final TP: $220–$230+ (Wave 5 projection zone)