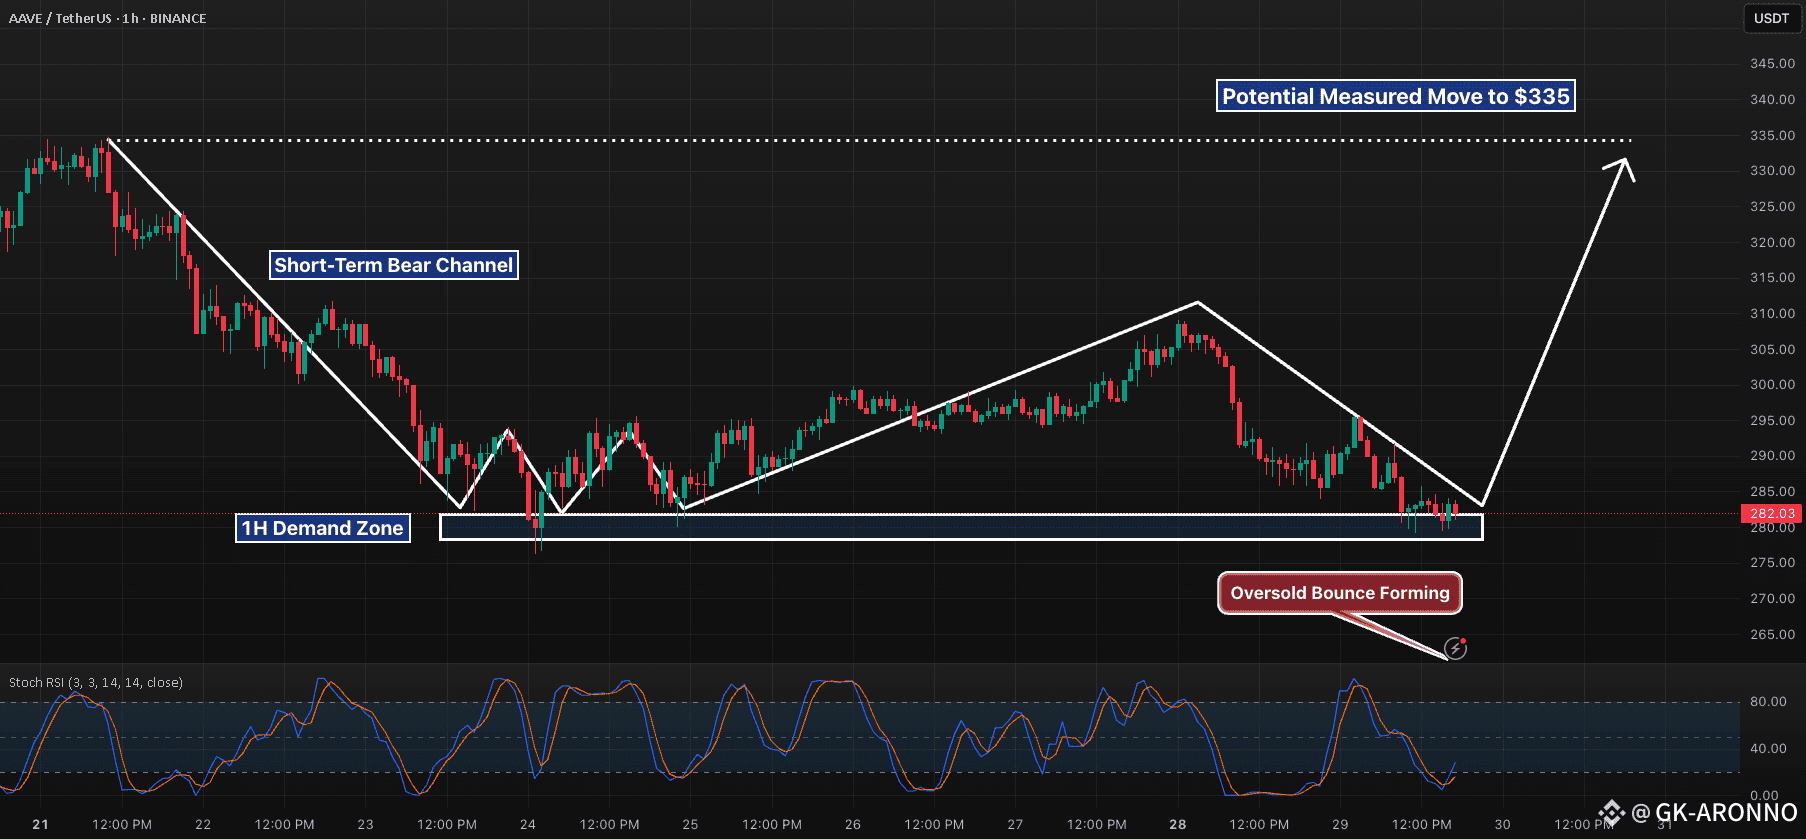
AAVE is painting a compelling reversal setup on the 1H timeframe. After a sharp selloff last week, price has tapped the $278–282 demand zone multiple times — each time printing higher local lows on the Stochastic RSI and showing signs of exhaustion from sellers.
This zone has now been tested three separate times, forming what looks like a triple-bottom structure. During the latest retest, Stochastic RSI is deeply oversold and beginning to curl up — suggesting that momentum may shift in favor of the bulls soon.
We’re also approaching the apex of a descending trendline, meaning compression is reaching its limit. A clean break and reclaim above $290 could be the first real sign of trend reversal, with a potential target near the previous range highs around $335 if momentum follows through.
📊 Why This Setup Matters:
– Strong historical support zone with visible reactions
– Repeated seller failure to break the zone cleanly
– RSI bullish divergence building beneath structure
– Clear invalidation level below support
– Risk-reward skewed in favor of a bounce play
This isn’t confirmation yet — but it’s definitely a chart worth watching closely over the next session. If bulls step in with volume, this could catch momentum fast