Liquidity is one of the core pillars in the ICT trading methodology. It helps traders understand where the smart money is heading and where price is likely to react. In this lesson, we will explore all types of liquidity in ICT, explain each concept in detail, and end with a practical exercise.
1. What is Liquidity in ICT?:
Liquidity in the context of ICT refers to areas on the chart where there is a cluster of stop-loss orders — whether from buyers or sellers. These areas become targets for institutional moves, as large players need liquidity to fill their orders.
2. Types of Liquidity in ICT:
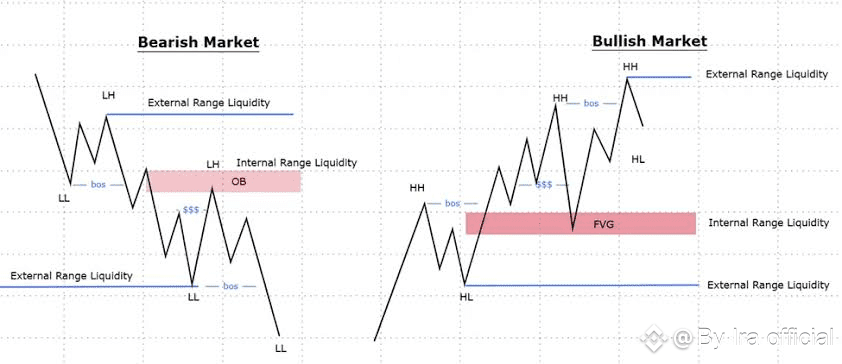
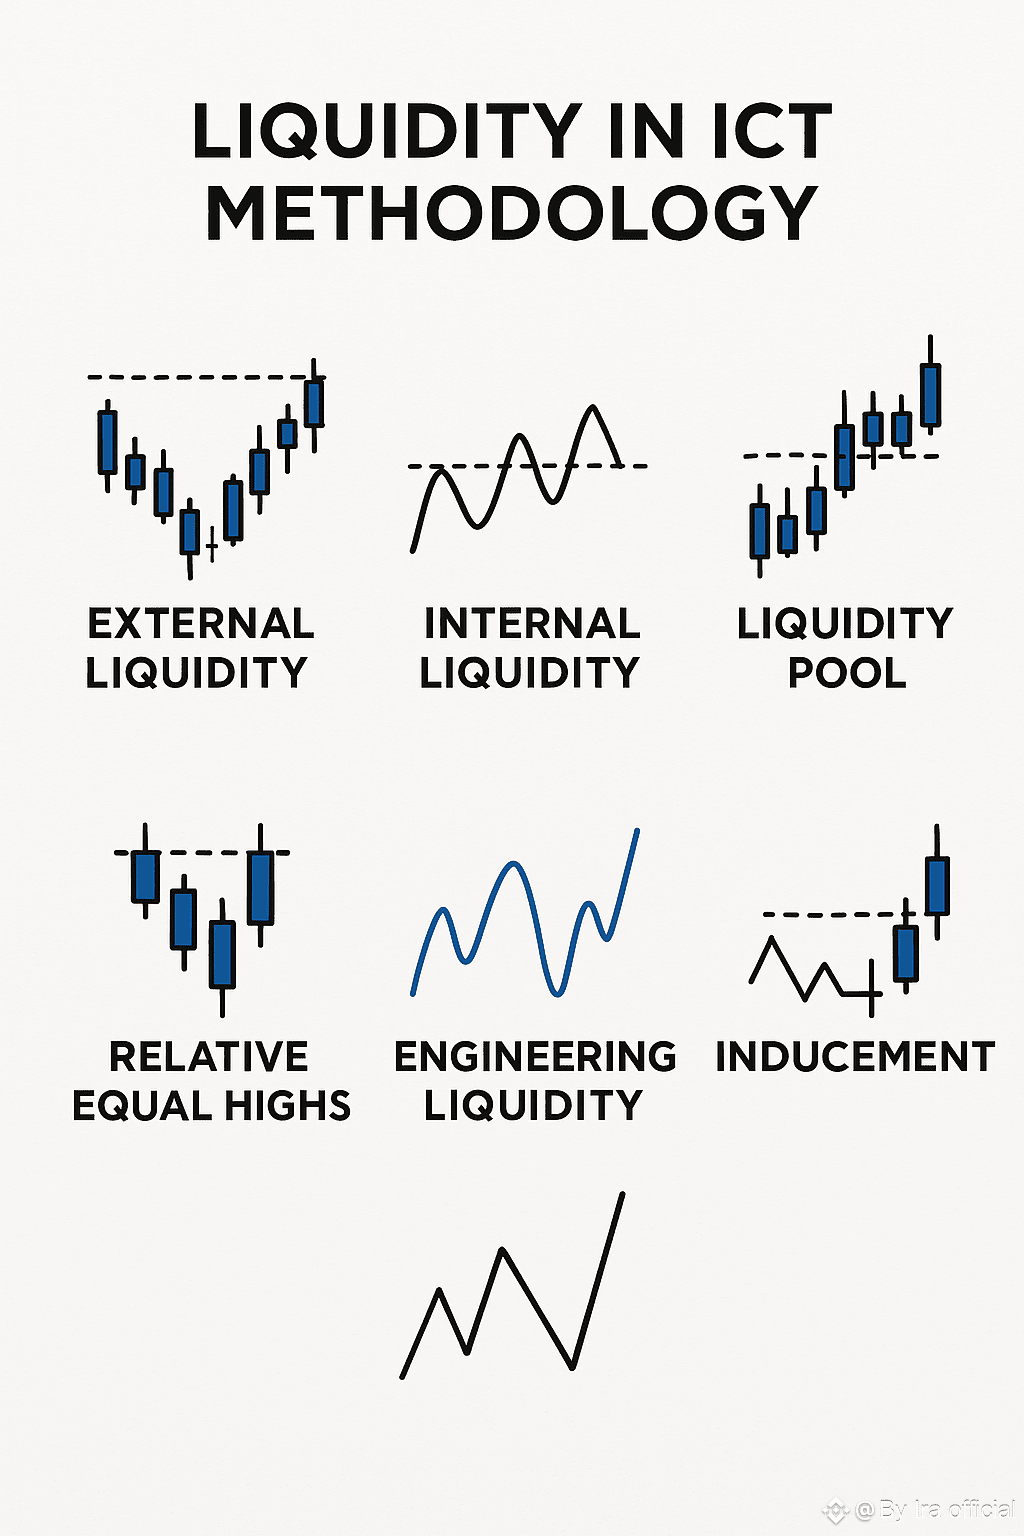
1. External Liquidity:
These are the obvious highs and lows that retail traders use to set their stop-loss orders. For example:
The highest high in a bullish market.
The lowest low in a bearish market.
> Institutions often push price beyond these levels to "grab liquidity" and then reverse.
2. Internal Liquidity:
These are less obvious liquidity areas found inside price ranges. These include:
Minor highs and lows formed during consolidation.
Weak support and resistance levels.
> Internal liquidity is often used during accumulation or distribution before external liquidity is targeted.
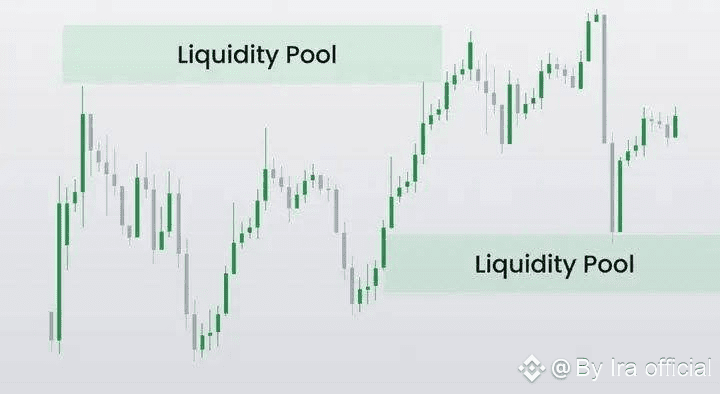
3. Liquidity Pools:
Liquidity pools refer to zones where multiple stop-losses and pending orders accumulate — typically at:
Previous highs/lows.
Equal highs/lows.
Psychological levels (e.g., round numbers).
> Smart money aims to sweep these zones to execute large positions efficiently.
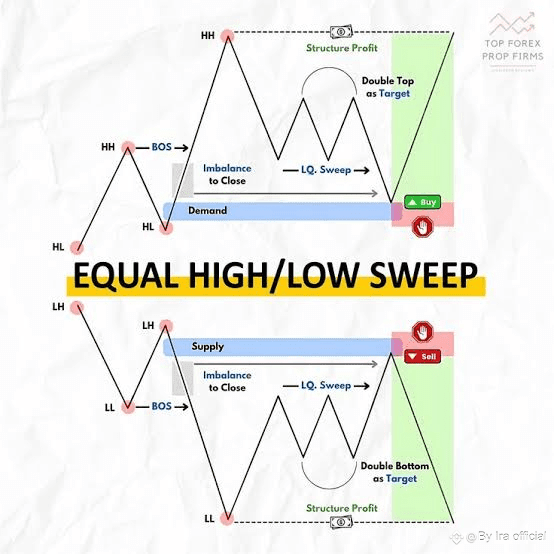
4. Relative Equal Highs/Lows:
When price forms two or more highs/lows at nearly the same level, this creates a trap for traders who believe it's strong resistance or support.
> In reality, this is a sign of liquidity engineering. Price usually revisits these levels to sweep the liquidity above or below them.
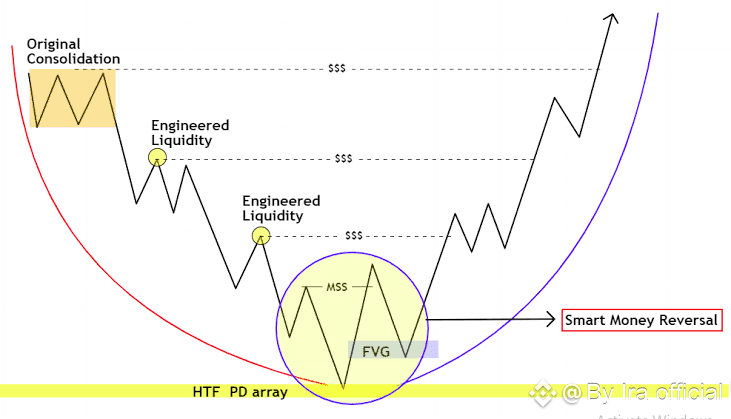
5. Engineered Liquidity:
This refers to areas where institutions intentionally create patterns that lure traders into placing stop-losses in specific places — such as:
Double tops/bottoms:
Trendlines.
Fake breakouts.
> Once enough orders are collected, price moves sharply in the opposite direction.
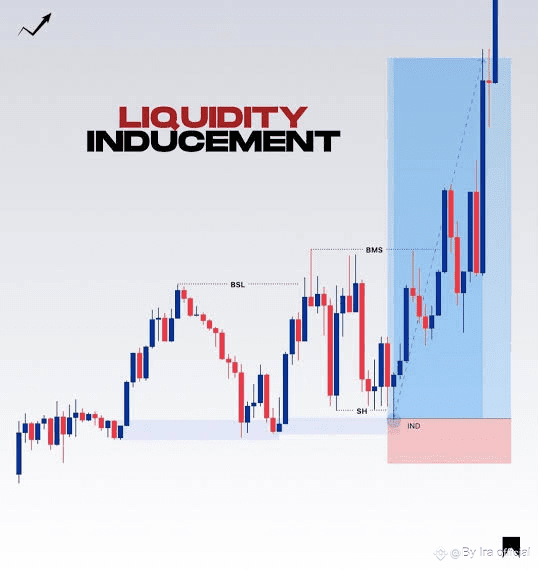
6. Inducement Liquidity:
Inducement happens when price gives the illusion of breaking out or forming a clear pattern to induce traders to take positions — only to reverse shortly after.
> This is used to “induce” retail traders into providing the necessary liquidity.
3. Why Is Understanding Liquidity Important? :
Understanding liquidity helps traders:
Anticipate false breakouts (stop hunts).
Identify optimal entry and exit points.
Trade with smart money, not against it.
Avoid emotional trading traps.
4. Practical Example:
Let's say you're watching BTC/USD on the 1H chart. You notice:
A relative equal high forming at $60,000.
A liquidity pool just above at $60,200.
Price consolidates near that area.
A retail trader might short at $60,000 with a stop-loss at $60,200. But an ICT trader would:
Wait for a sweep of $60,200 (liquidity grab),
Then enter a short after a market structure shift (e.g., break of a low),
With a tight stop above the high and a risk-to-reward plan in place.
5. Exercise:
Look at any crypto or forex chart and do the following:
Identify 2 external liquidity zones.
Identify 1 area with internal liquidity.
Find an example of inducement or engineered liquidity.
Predict where smart money might move next and why.
Conclusion:
Liquidity is not just a technical concept — it’s the heartbeat of price action in ICT. The ability to recognize liquidity zones gives you a significant edge in trading with smart money. Practice identifying these zones and observe how price reacts around them — you’ll start seeing the market in a new way.
🌟 If you found this lesson helpful, don’t forget to like and follow so you don’t miss future posts.🙏❤
✍️ Let me know in the comments if it was clear or if there’s anything you’d like me to add.
#BinanceHODLerTree #Binance #LearnFromMistakes #lessonlearned #ict


