hi Traders,
We can see Bullish Signals Developing
Bullish Divergence (RSI):
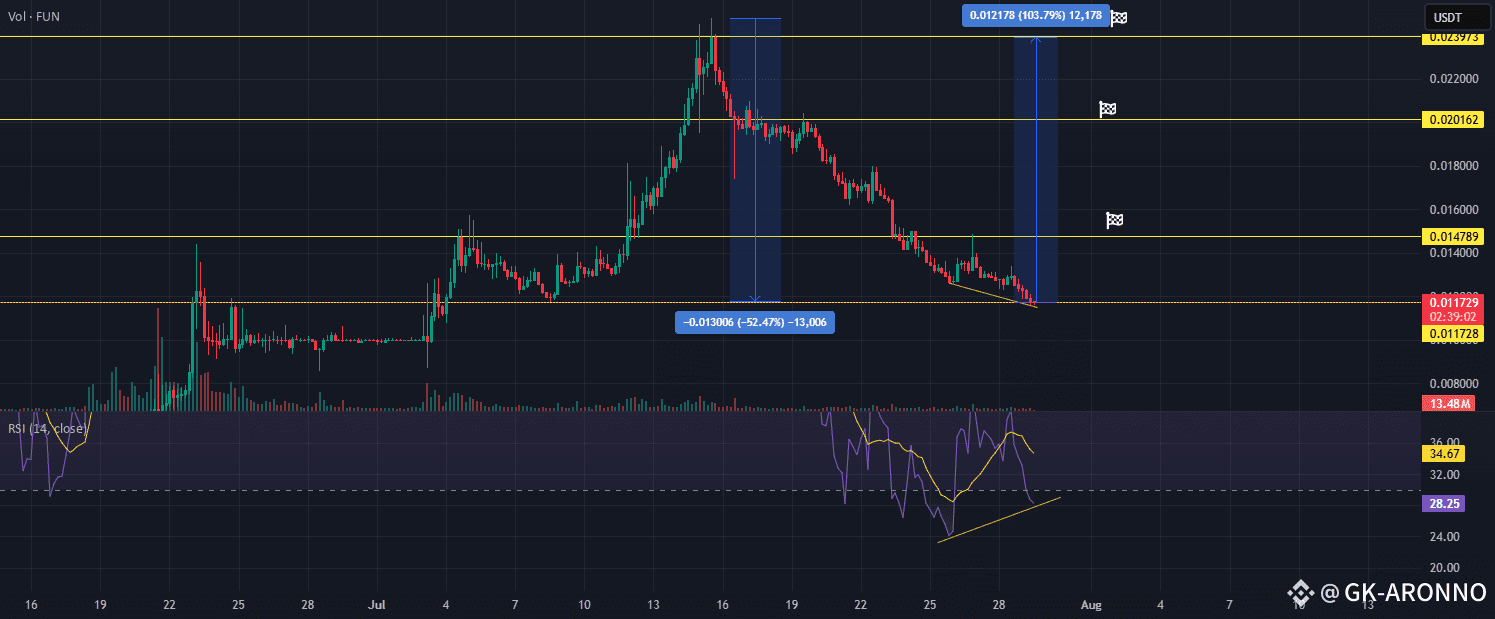
A clear bullish divergence is visible between the RSI and price action. While the price made lower lows, the RSI formed higher lows (28.35 vs. previous 24 region), indicating a potential loss of bearish momentum and the emergence of buying pressure at lower levels.
Oversold RSI:
The RSI is recovering from oversold conditions and is currently around 34.68, showing that the asset may be primed for a short-term rebound.
🟡 Key Support Zone: Previous Resistance Flip
The current price action is retesting a previous top (~0.01172 USDT) from mid-July, which now acts as support.
This level previously acted as a breakout zone during the upward rally and is a logical area where buyers may step in again.
If this support holds, it increases the probability of a reversal or consolidation phase.
📊 Potential Reversal Targets
First Target: 0.01478 USDT (mid-range resistance)
Second Target: 0.01600 USDT
Third Target: 0.02016 USDT (strong resistance from recent top consolidation)
📉 Risk Management
A daily close below 0.01170 would invalidate the bullish setup, indicating possible continuation of the downtrend.
Volume remains moderate (13.43M), so confirmation via bullish candle and volume pickup is ideal.
✅ Conclusion:
FUN/USDT is showing early signs of a potential bullish reversal, backed by RSI divergence and a retest of prior resistance now acting as support. Traders may consider this a watchlist candidate for a bounce setup, with well-defined invalidation and targets.