Technical analysis of Bitcoin (BTC/USDT) on the 4-hour timeframe, indicating a potential rally toward the 130,620.60 target zone. Here's the detailed breakdown:
Technical Analysis – BTC/USDT (4H)
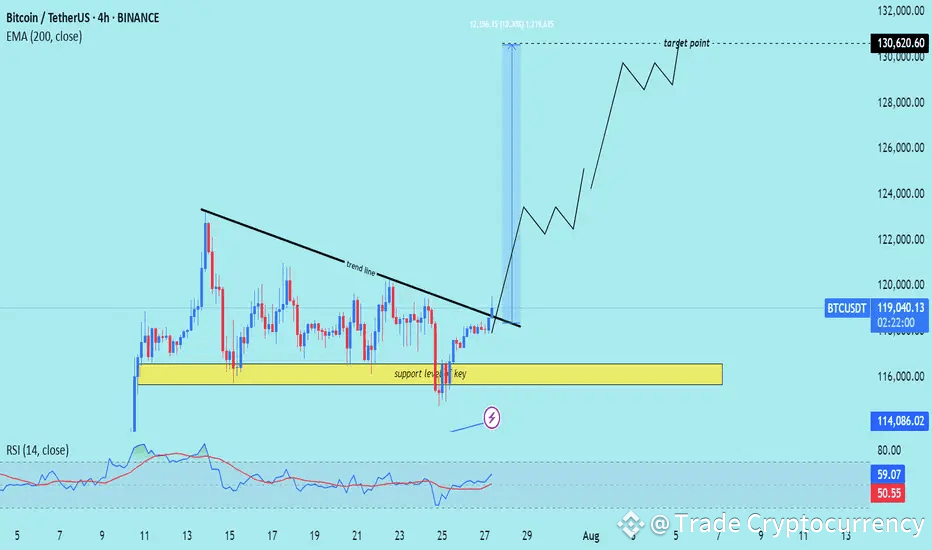
1. Key Support Level Holding
The yellow zone highlights a strong support zone around 116,000, which has been tested multiple times without breaking.
Marked as “key support level,” it has acted as the foundation for a bullish reversal.
2. Trendline Breakout
A descending trendline was broken decisively with strong bullish candles, signaling a trend reversal.
The breakout was followed by increased momentum and volume, supporting the move higher.
3. Target Projection
The chart shows a projected move up to 130,620.60, labeled as the target point.
This target aligns with a measured move or prior resistance, suggesting a potential swing high objective.
4. 200 EMA Support
Price is well above the 200 EMA (at 114,088.52), confirming the uptrend and acting as dynamic support.
5. RSI Confirmation
RSI is at 60.62, reflecting bullish strength with more room before reaching overbought levels.
Momentum supports the continuation of the uptrend.
Trade at your own Risk 👍
Best Regards, Trade Cryptocurrency
Stay Tuned for Further Updates.