Candlesticks represent yin and yang, the law of extremes leading to decline, and the natural cycle of decline leading to revival. The cryptocurrency market is no different; when good things reach their peak, they will turn towards bad, and conversely, when bad things reach their peak, they will turn towards good. This is the essence of all things, the result of the yin-yang struggle. Candlestick patterns are not the only means, but to survive in the cryptocurrency market, traders must combine practical experience, self-improvement, and refinement to enhance themselves.
Candlestick Basics
Candlestick charts, also known as candlestick patterns, originated during the Tokugawa shogunate in Japan, where they were used by merchants in the rice market to record market conditions and price fluctuations. Later, due to their intricate and unique drawing style, they were introduced into the capital markets.
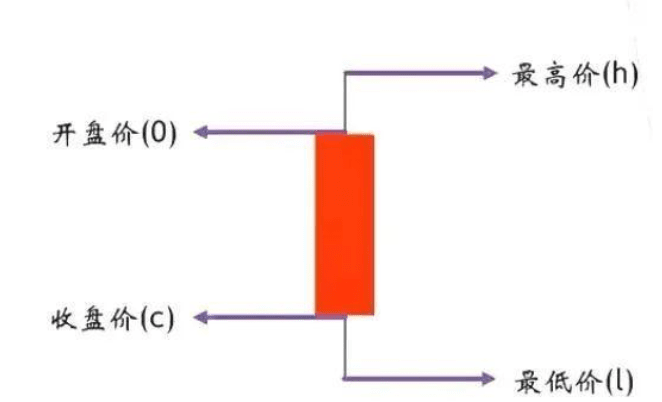
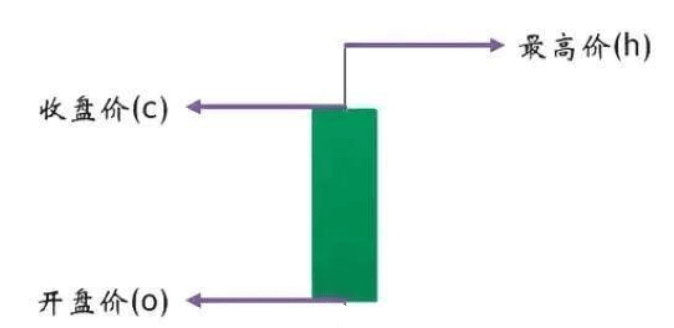
Candlesticks are drawn based on the opening price, highest price, lowest price, and closing price of each analysis period. The structure of a candlestick can be divided into three parts: upper shadow, lower shadow, and the body.
In the cryptocurrency market, green represents bullish and red represents bearish. Through candlestick charts, we can fully record the market performance of each analysis period. After a period of price consolidation, a special area or shape is formed on the chart, with different shapes indicating different meanings. We can explore some规律 from these changes in shapes. Generally speaking, candlestick patterns can be divided into reversal patterns, consolidation patterns, gaps, and trend lines.
Practical significance of lines
In the cryptocurrency market, trading candlestick charts is the most intuitive analytical tool. A falling leaf signals the arrival of autumn; this is the way of thinking that candlestick charts bring us. Simple candlesticks remind us that no matter how the cryptocurrency market operates, we can find clues in the details. Whoever can grasp the clues indicated by candlesticks more quickly and accurately can avoid more losses and thus obtain greater gains.
In fact, different people have different 'views' when looking at candlesticks. Therefore, the same candlestick chart presented to numerous investors can yield multiple different 'analyses.' It is precisely such results that make the competition in the cryptocurrency circle more intense. Sometimes, after engaging in quantification or trading for a while, one gradually discovers that candlesticks can be deceptive and atypical. Thus, one may feel troubled daily, questioning why things happen this way when theoretically they should follow a certain path. Gradually, one begins to doubt candlesticks, studying market makers, fake breakouts, and so on. Conspiracy theories pervade the entire immersion phase. Sometimes, perhaps it is luck, with a few random contrary trades or imaginations leading to a few successful trades, making one feel as if they have truly grasped the essence behind candlesticks, believing they have mastered the market's pulse. However, more often than not, like in the previous phase, one still fails to achieve good results after quantification. Many people get stuck in this phase, remaining stagnant and hesitant. But once you truly move past it, you will find that whether you believe it or not, candlesticks operate in that way. Whether you act or not, they are still there. They are neither divine nor worthless. They are merely a testament to the market's operational trajectory; there is no need to mythologize them or to belittle them.
The interpretation of candlesticks has become increasingly complex. As the investment community progresses and investment capital grows, the short-term candlesticks in the market are often manipulated to create 'traps.' Therefore, we need to filter using relative principles and technical analysis methods, including quantitative measurement standards and analytical work, so that we can improve the probability of successful analysis and operations. Even without candlestick charts, investing remains investing, and the path will still be tortuous, and other methods can still be used. However, in facing the investment reality we are in, the thinking of candlesticks cannot be overlooked, as, to some extent, it is one of the starting points of real investment.
Many people firmly believe that the premise of candlesticks is: the market is always right. Therefore, when seeing a certain candlestick pattern, because the market is always right, what the candlestick reflects now will also be the future trend of the market. In fact, I believe many people who are new to trading will have a question: why do perfect technical patterns often yield contrary results? This is not due to the technique being wrong nor the user's fault; it's just that we often only see the 'perfect' technical patterns and only see what we believe to be right.
Analysis of various basic patterns of individual candlesticks
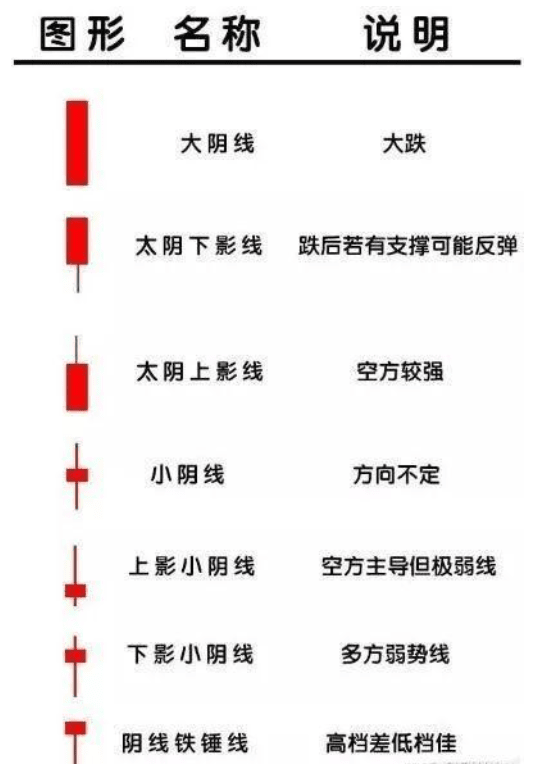
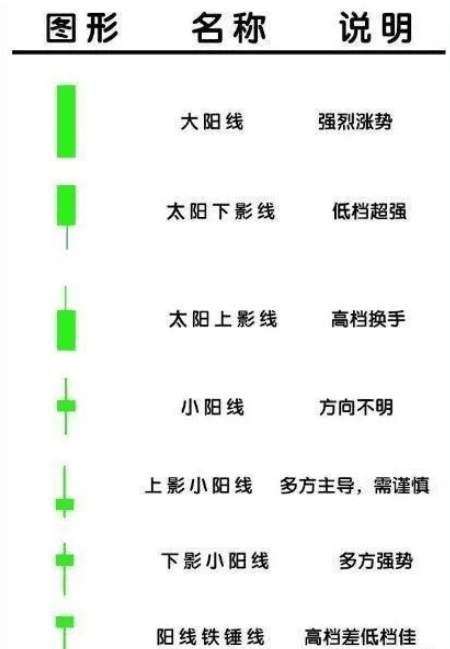
Look at yin and yang
It is about looking at the direction. Taking a bullish candlestick as an example, if the closing price is higher than the opening price after a period of bullish and bearish struggle, it indicates that the bulls have the upper hand. According to Newton's laws of motion, in the absence of external forces, the price will continue to move in the original direction and speed, thus the bullish candlestick implies that it will continue to rise in the next stage, at least ensuring an initial upward momentum in the next stage. Therefore, a bullish candlestick often indicates a continuation of the upward trend, which aligns with one of the three major hypotheses in technical analysis that stock prices fluctuate along trends. Similarly, a bearish candlestick implies continued decline.
Look at the size of the entity
The size of the entity represents intrinsic momentum; the larger the entity, the more evident the upward or downward trend is, and vice versa. Taking the bullish candlestick as an example, its entity represents the portion where the closing price is higher than the opening price. The larger the body of the bullish candlestick, the stronger the upward momentum, akin to the principle of physics where greater mass and speed generate greater inertia. The larger the body of the bullish candlestick, the greater its internal upward momentum, thus its upward momentum will surpass that of smaller bullish candlesticks. Similarly, the larger the body of a bearish candlestick, the stronger the downward momentum.
Look at the length of shadows
Shadows represent reversal signals. The longer the shadow in one direction, the less favorable it is for the stock price to move in that direction. For example, the longer the upper shadow, the less favorable it is for the stock price to rise; the longer the lower shadow, the less favorable it is for the stock price to fall. Taking the upper shadow as an example, after a period of struggle between bulls and bears, the bulls eventually lose, leading to a scenario where the upper shadow part constitutes the upper resistance for the next stage, making the probability of price adjustment downward large. Similarly, the lower shadow indicates a higher probability of upward attack.
What is the battle between bulls and bears often mentioned in the cryptocurrency circle?
Bulls and bears are two factions. The bulls represent the green faction, while the bears represent the red faction. The two sides have different views; the bulls believe prices will rise, while the bears believe prices will fall, which often leads to battles. The green faction consists of individuals who are bullish on prices; they will buy, pushing prices up. The red faction consists of individuals who are bearish on prices; they will sell, causing prices to fall.
In every time period, battles will occur; if the bearish red army wins, prices will fall, and the candlestick chart will display red. If the bullish green army gains a huge advantage, it indicates strong power, and the candlestick displayed will be larger. If the green side's resistance is weak, it indicates that the resistance posed to the red side is too small, resulting in very short shadow lines on the candlestick chart.
Analysis of various basic patterns of candlestick combinations
Dark Cloud Cover Combination
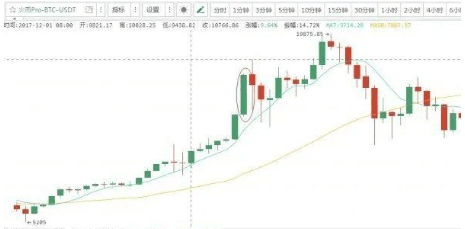
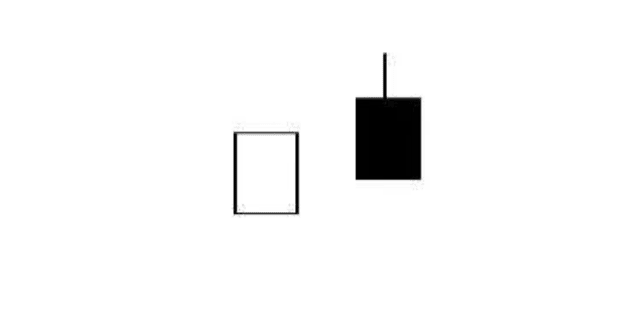
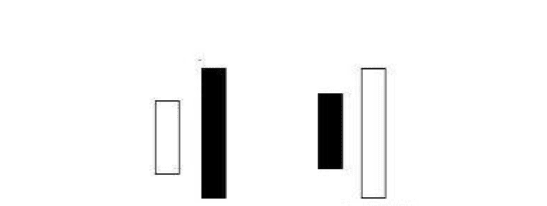
After the price rises with a bullish candlestick, if a bearish candlestick appears, and this bearish candlestick causes the price to drop below half the body of the previous bullish candlestick, this combination often occurs after the market has risen significantly, or even reached a peak, indicating a market reversal followed by a downward trend.
Island Combination
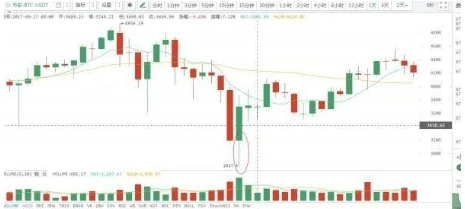
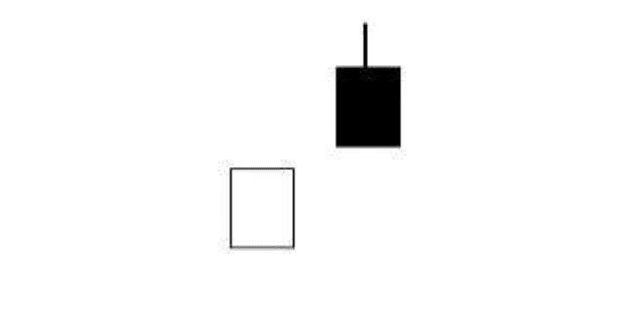
After a period of rising market, a gap bearish candlestick appears, resembling an island. This combination, although the closing price of the bearish candlestick is still higher than yesterday, reveals the weakness of the market participants' mentality and the manipulation techniques of early profit-takers, indicating that the future market outlook is not optimistic.
Pillar of Strength Combination
This combination is relative to the 'Dark Cloud Cover' combination. After a bearish candlestick appears and the price drops, if a bullish candlestick follows and this bullish candlestick causes the price to rise above half the body of the previous bearish candlestick, this combination often occurs after the market has fallen significantly or even reached a low point, indicating a market reversal followed by an upward trend.

Engulfing Combination
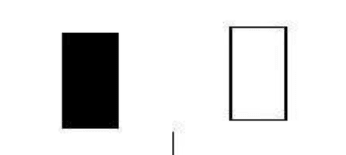
The entities are yin and yang, but today’s long entity completely engulfs yesterday’s small entity, indicating that the market will develop in the direction of the long entity.
孕育组合
The entities are yin and yang, but in contrast to engulfing combinations, it is the small entity of today being engulfed by the large entity of yesterday, resembling being nurtured in a womb, hence named the孕育组合. Whether related to genetics or not, this孕育组合 often indicates that the future market direction is aligned with the mother body’s direction, that is, bullish孕阴生阳, bearish孕阳生阴.

Morning Star Combination
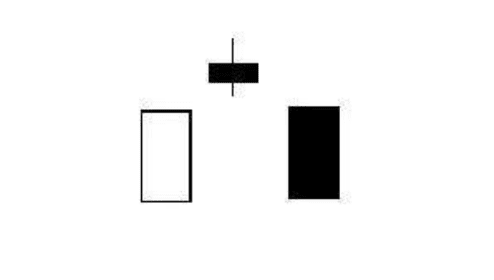
This combination appears after a bearish candlestick, first showing a small bullish candlestick or small bullish doji, followed by a large bullish candlestick that gaps up. This combination often appears after a long period of decline or consolidation. The small bullish candlestick below is like the long-awaited morning star in the minds of market participants, and the subsequent strong rising bullish candlestick indicates that the long night has passed and the market is welcoming light. Therefore, the Morning Star combination becomes a turning point for the market to reverse and rise.
Evening Star Combination
This combination is exactly the opposite of the Morning Star combination, becoming a turning point for the market to reverse downward. The gap doji at the top, followed by a gap down bearish candlestick, finally becomes an Evening Star. If the top is an inverted T-line with a medium upper shadow, this combination is also vividly referred to as a 'Shooting Star.'
Three Red Soldiers Combination
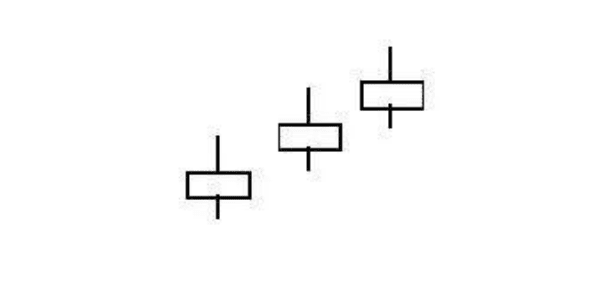
When this combination of three small bullish candlesticks appears in the low area, it indicates that the market has emerged from a long-term bearish shadow and is on the path to rebound.
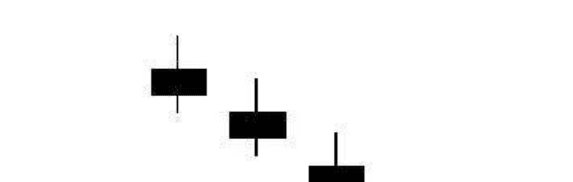
Three Black Crows Combination
When this combination of three consecutive black crows appears in the high area, it indicates that the upward market has ended and the downward market has begun.
Using candlesticks to describe the market has a strong visual effect and is one of the best charts to represent market behavior. Nevertheless, some common candlestick combinations are merely based on empirical summaries of typical shapes without strict scientific logic. When applying candlesticks, keep the following points in mind.
1. Candlestick combination analysis will have a certain error rate. Market fluctuations are complex, and the actual market situation may differ from our judgments. Empirical statistics show that the success rate of using candlestick combinations to predict future markets is not very high.
2. Candlestick analysis methods must be combined with other methods. Only after making decisions about whether to buy or sell using other analysis methods should you use candlestick combinations to choose the specific time and price to take action.
3. Continuously 'modify, create, and adjust' combination patterns based on actual situations. Combination patterns are merely the product of summarizing experiences. In the actual market, situations that fully meet the candlestick combination patterns we describe are rare. Rigidly copying combination patterns without any changes may result in missing suitable opportunities for a long time. The combination patterns should be adjusted appropriately based on the situation. One should understand the internal and external principles of each combination pattern. Because it is not a perfect technique, this is similar to other technical analysis methods. Candlestick analysis is built on human subjective impressions and is one of the analytical methods based on expressing historical shape combinations.
Follow Awen. Throughout all the fans' investment processes, we not only provide investors with analytical ideas for market trends, basic knowledge of watching the market, and methods for using various investment tools, but we will also bring exciting fundamental interpretations, sorting through chaotic international situations, and discerning various investment forces.


