🟢Powerful Candlestick Patterns:𝗣𝗮𝗿𝘁-14
🎖️14. Bearish Harami
🔹A bearish harami pattern is a two-candle pattern. A bearish harami pattern results from a small body (Red) candle developing after a larger body (Green). Usually showing a possible bearish trend reversal, this pattern appears at the top of the price chart.
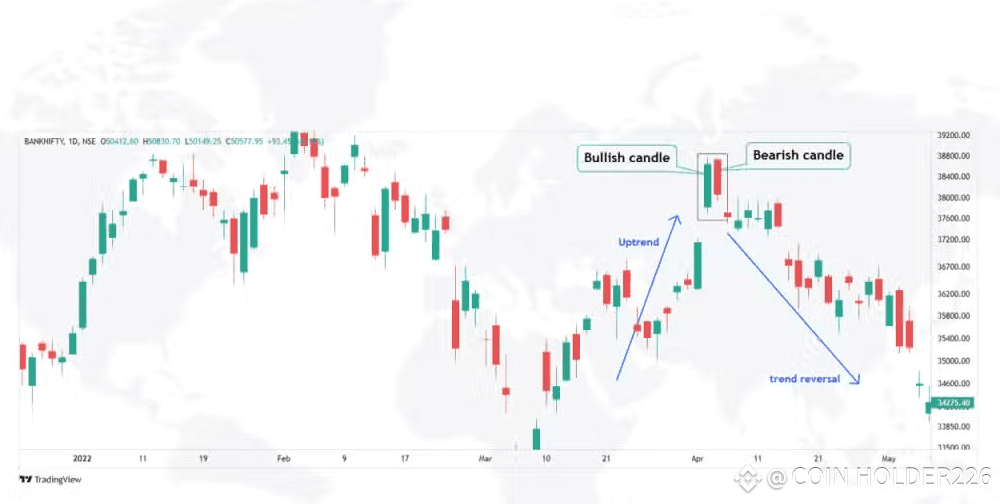
🔹The bearish harami pattern is a strong bearish signal that suggests the market may be near a top or a significant high. The large bullish candlestick represents the buying pressure in the market, while the smaller bearish candlestick that follows shows the bears gaining control and driving prices lower. To bearish harami, one compares the bearish engulfing pattern, as both suggest the market may be near a top or a significant high.
🔹According to a study titled “The Effectiveness of Candlestick Patterns in Financial Markets” conducted by Professor Wing-Keung Wong and his team at the Department of Economics, Hong Kong Baptist University, the bearish harami pattern has a success rate of approximately 63% in predicting bearish reversals.
🔰 Join us: @COIN HOLDER226 #MarketMoves #analysis #PATTERN #HowTo #ProfitableTrades