Kaspa price is heating up again. After a short breather, the price is back in the green, up more than 6% today and trading around $0.1069.
That puts it among the top 10 gainers right now, with trading volume jumping nearly 70% over the past day.
Price is once again knocking on the door of a key resistance zone between $0.110 and $0.117, the same area where the last rally cooled off.
Momentum is strong on the charts, and how Kaspa price breaks or gets rejected here will set the tone for what comes next.
Let’s take a closer look at the setup.
Kaspa Snapshot (July 28)
Current Price: $0.1069
24h Change: +6.18%
RSI (1H): 64.11
EMA (4H): $0.10104
Volume: Up nearly 70%
Trend: Still bullish
Kaspa price is staying well above its 50 EMA on the 4-hour chart and continues to respect a rising trendline that’s been in play since late June. Buyers stepped in just above $0.101 after the last dip, and now price is bouncing back toward that key resistance area.
What the KAS Chart Shows
Kaspa 4H chart still looks strong. There’s a clear uptrend in place, with higher highs and higher lows all the way through July. Every pullback has found support along a rising diagonal trendline, and the 50 EMA has held up too.
After hitting a local top near $0.117, KAS price dropped back down to test support at $0.101, where it bounced and started climbing again. Now it’s making another run at that $0.110–$0.117 zone, which is the next big test.
Break that, and Kaspa could be headed for $0.125 or higher. If not, we could see a bit of sideways action or even a retest of the lower support range near $0.095.
Read Also: Ripple Just Made Its Boldest Move Yet – Will This Send XRP Price to $4?
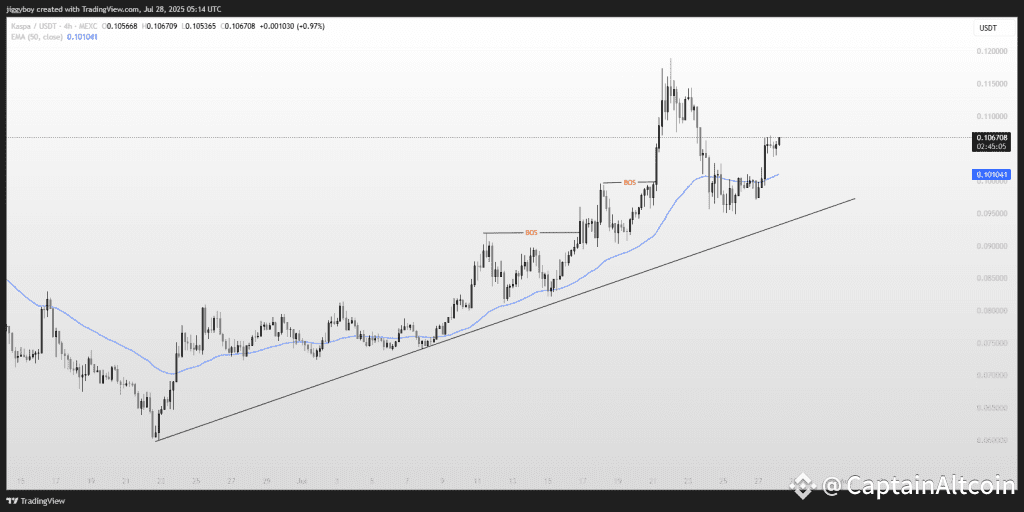 Image Source: TradingView.com Technical Indicators (Hourly Timeframe) Indicator Value Signal / Interpretation RSI (14) 64.11 Bullish momentum, room before overbought zone ADX (14) 49.93 Strong trend strength confirmed MACD 0.001 Bullish crossover remains intact CCI (14) 123.85 Strong upside momentum ROC 0.39 Positive trend with consistent price growth Bull/Bear Power 0.003 Bulls remain in control
All indicators suggest continued upward pressure. Momentum is building, but the market is approaching short-term overbought levels, especially on the CCI and RSI readings. A breakout could stretch the move further, while exhaustion may lead to consolidation.
Kaspa Price Prediction Scenarios
Bullish Scenario:
If KAS price breaks and closes above $0.117, buyers can target $0.125 next. The setup remains bullish for continuation as long as momentum dominates.
Neutral Scenario:
Sideways movement between $0.101 and $0.110 is likely if the market stalls under resistance without major selling.
Bearish Scenario:
Break of support at $0.101 can open the way towards $0.095, or even $0.090, if overall market sentiment weakens.
Wrapping Up
Kaspa price is in a good spot right now. It’s trending up, momentum is strong, and today’s pump has pushed it right back to a key resistance area. Whether it breaks above or not could shape the next big move.
For now, the bulls are still in charge, and all eyes are on the $0.110 zone.
Subscribe to our YouTube channel for daily crypto updates, market insights, and expert analysis.
The post Kaspa (KAS) Price Prediction For Today (July 28) appeared first on CaptainAltcoin.

