The BNB/USDC pair is showing strong bullish momentum as it climbs to $796.52, reflecting a solid +1.93% daily gain. With the price up over 8.95% this week and 23.33% over the past month, traders are watching closely for a potential breakout.
📈 Key Highlights from the Chart:
24h High: $799.73
24h Low: $778.84
Volume (24h): 25.05M USDC
Trend Strength: Strong upward recovery from a recent dip near $743.36
Current Resistance: Around $799–$810
Support Level: $784 and below
🔍 Market Sentiment:
The sentiment is leaning bullish, with 56.56% of orders on the sell side vs 43.44% on the buy side, suggesting potential profit-taking at this resistance level. However, volume remains healthy and steady, giving confidence to buyers.
🔄 Technical Overview:
90-day performance: +32.07%
1-year gain: +37.64%
Momentum indicators (MACD, EMA) hint at a continuation of the bullish trend, but some short-term consolidation near the $800 mark could oc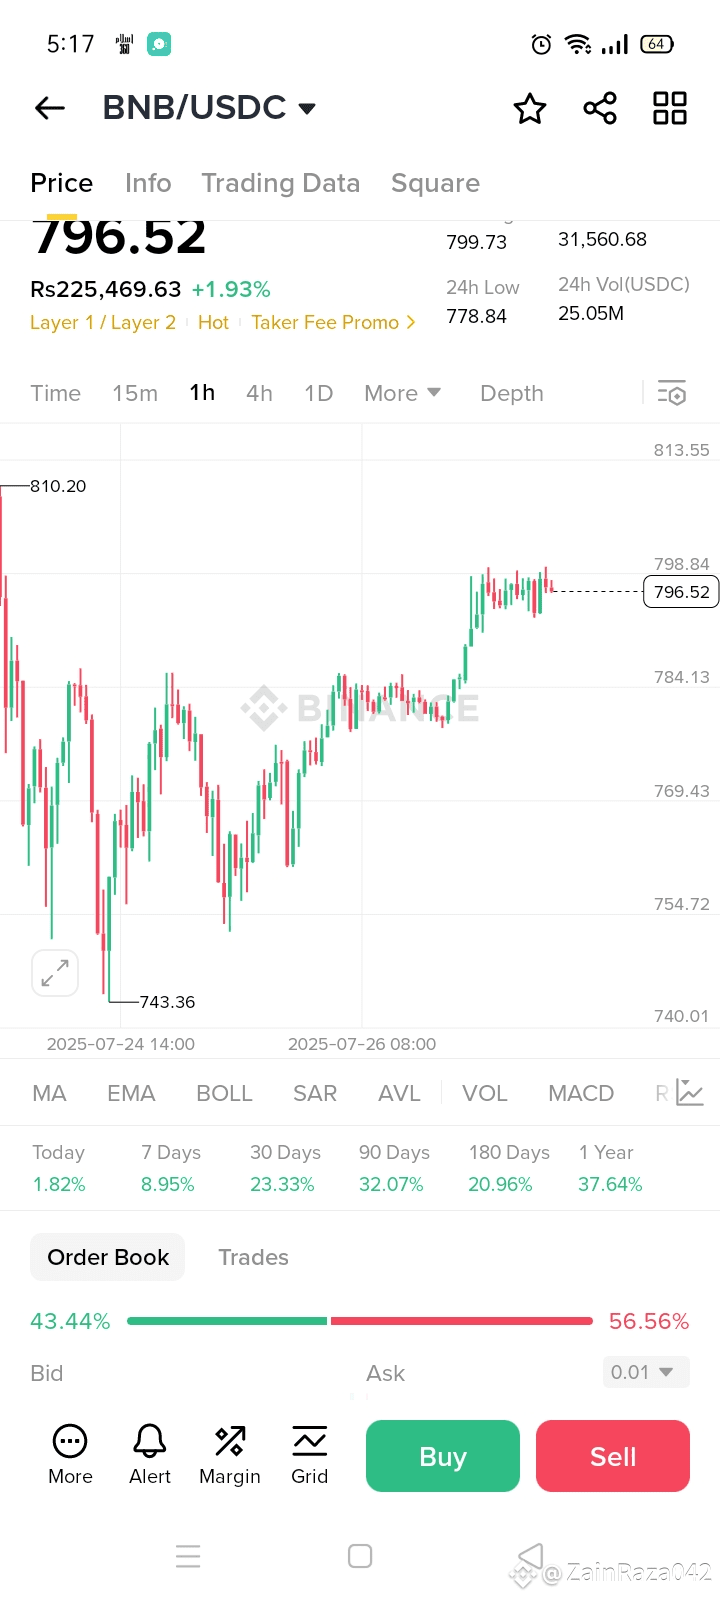 $BNB
$BNB
cur before the next leg up.