Ancient Whale Sells All of Its BTC
A shockwave rippled through the crypto markets as news broke that a storied Bitcoin “whale” has dumped its entire holdings. According to on-chain analysts, Galaxy Digital facilitated the sale of an “80,000 BTC ancient whale,” liquidating roughly $9 billion worth of bitcoin. In practice, the firm moved over 17,000 BTC (about $1.7B) from long-dormant wallets into major exchanges, exerting heavy sell-side pressure and briefly driving Bitcoin’s price down about 2.5% to ~$115,600. This represents one of the largest single transactions in crypto history, and it has heightened uncertainty: Arkham Intelligence data shows that a net 40,000 BTC flowed out of large wallets over a week, and analysts warn that further distribution into thin order books could push prices even lower. In short, an early Satoshi-era holder has orchestrated a massive exit, rattling markets and testing key support levels.
Bitcoin was introduced in 2008 by the pseudonymous Satoshi Nakamoto. Its whitepaper described a decentralized peer-to-peer currency with a hard cap of 21 million coins (no more will ever be minted). This scarcity was built in from the start. Over the past decade-and-a-half Bitcoin has grown from a fringe experiment to a global financial asset: it has been called “digital gold” and a hedge against inflation. As the price chart above shows, BTC’s trajectory has been marked by epic booms and busts. It reached ~$69,000 in late 2021 before crashing below $20,000 by the end of 2022, only to rally back past $73,000 in early 2024 and exceed $100,000 by late 2024. These extreme swings highlight Bitcoin’s volatility and its historical significance: each cycle has captured investors’ attention, propelling the network’s development and adoption.
Market Data: Prices, Volume, and Supply
By mid‑2025 Bitcoin had set new records, fueled by institutional flows and macro trends. Today (July 26, 2025) BTC trades near $117–118K, giving it a market capitalization on the order of $2.3–2.4 trillion. In practical terms, about 19.90 million BTC have been mined so far – roughly 94.75% of the 21M limit. Only ~1.1 million BTC (about 5.3%) remain to ever be issued. This vanishing new supply is a key part of Bitcoin’s value proposition: as one recent analysis notes, every halving reduces issuance and by now **“only 5.25% of the total BTC that will ever exist remains to be mined”**.
Trading activity has been enormous. Daily BTC volume on major exchanges routinely hits tens of billions of dollars. For example, CryptoSlate reported daily volumes above $94 billion during this sell-off episode. (StatMuse data show July 25 alone saw about $104.9B of trading volume.) In short, Bitcoin’s liquidity dwarfs its early days: it now trades tens of billions of dollars worth per day, reflecting widespread global participation. The combination of huge daily volume and a virtually fixed supply means that major trades – like this whale’s exit – can ripple through the market.
Technical Analysis: Price Action and Market Response
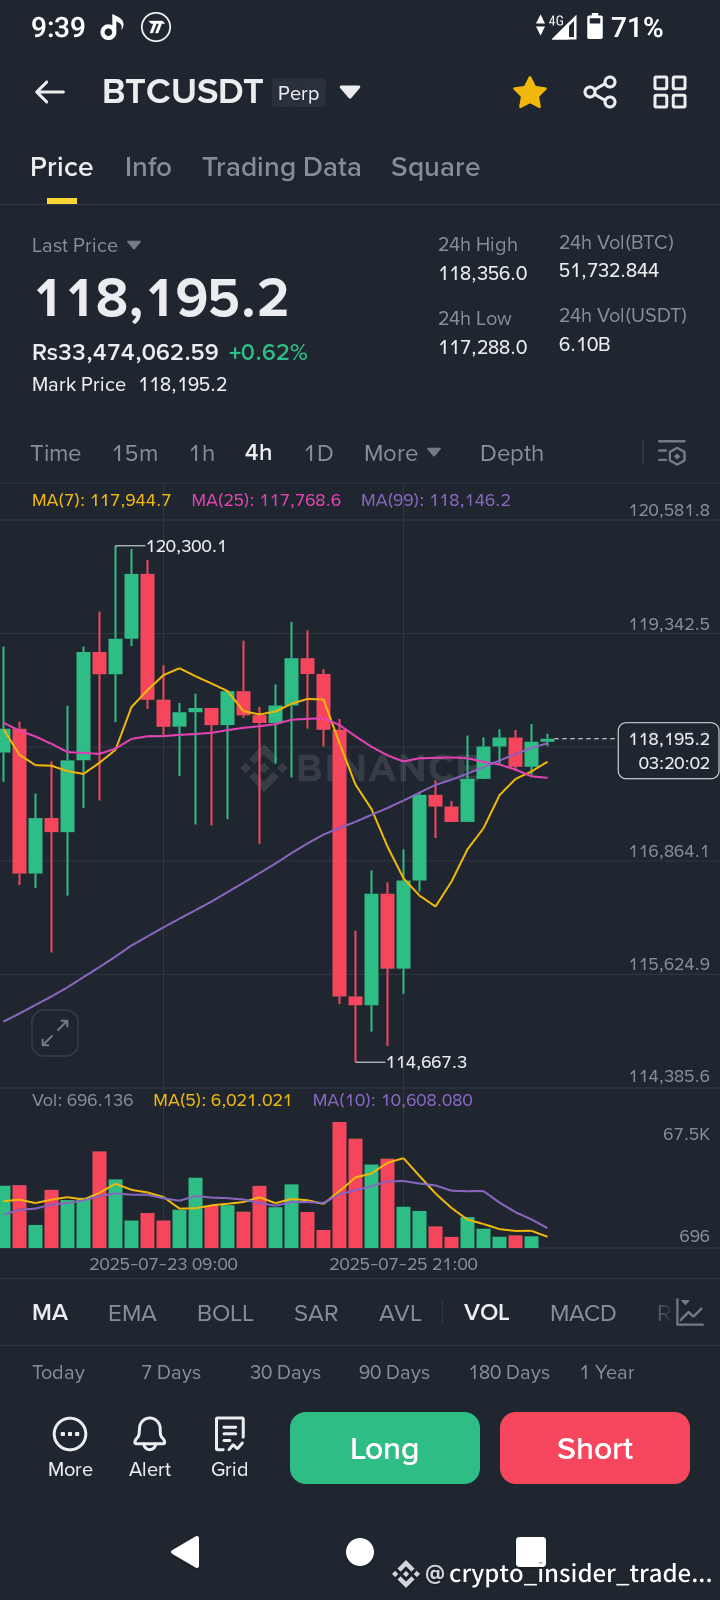
The whale’s movements have already left technical footprints on Bitcoin’s charts. When those 17,000 BTC hit exchange order books, the immediate result was a pullback: BTC fell about 2.5% and tested support in the $114K–115K area. Traders are now watching whether that zone holds. On the upside, Bitcoin has repeatedly struggled to clear the $122K level, which a Matrixport report flags as key resistance. (Above that, the next obvious barrier is psychological; historically BTC has had major congestion near previous all-time highs.)
On-chain data underscore the selling pressure. Analysts like Cauê Oliveira note a net outflow of ~40,000 BTC from large wallets in recent days, indicating the whale and other institutions are unloading coins. Exchange balance monitors similarly show spikes in deposits. Meanwhile, order books are relatively thin: CryptoSlate observed that the sudden sell-side pressure “intensified market volatility” as traders scramble for liquidity. In short, the whale’s liquidation has increased short-term volatility and reminds us that large orders can move the needle. Sentiment indicators have turned cautiously watchful – some fear and greed gauges tick up as selling mounts – but Bitcoin’s long-term uptrend (15 years old) still underpins many traders’ outlook.
Near- and Long-Term Outlook
Looking ahead, analysts offer a mixed but generally cautious-optimistic forecast. In the near term, seasonal and technical factors may dampen momentum. Matrixport’s recent report suggests Bitcoin is in a “typical summer correction” phase: with the corporate buying window closing and institutional inflows slowing, BTC may consolidate or drift downward before the next leg up. Indeed, Matrixport warns that large holders are likely to continue trimming positions in the coming weeks, potentially dragging prices lower. Bitcoin’s repeated failure to decisively break $122K resistance supports this view. That said, the firm also notes that any pullback could be a buying opportunity for long-term investors, especially if regulatory clarity (e.g. U.S. policy changes) renews institutional demand.
Wall Street strategists remain broadly bullish on a 12-month horizon. Citi Research, for example, lays out scenarios tied to spot ETF flows: in a base case with continued ~$15B annual ETF inflows, Bitcoin could hit $135K by end-2025; in a more aggressive case (surging ETF demand) it could approach $200K. These targets resonate with market sentiment: CoinDesk notes that whales are placing large bullish bets, such as a $23.7 million bullish options spread betting on a $140K–$200K price range by year-end. In other words, many large traders are effectively forecasting higher prices later this year.
Over the long term, fundamental scarcity and adoption trends may dominate. Only $710K** in a base-case by 2030 (with a bull-case around $1.5 million per coin). While such models rely on assumptions (ETF growth, on-chain finance, institutional demand), they illustrate how a shrinking supply and growing adoption could push BTC prices much higher over time. Ultimately, the “whale sell” is a short-term event, but Bitcoin’s long-term narrative—fixed supply, network growth and new use cases—remains intact for most proponents.
Conclusion
The unwind of this “ancient” whale’s position is a dramatic reminder of crypto’s history of wild swings. In the short run, it has injected volatility and tested technical floors around $115K. In the longer run, however, Bitcoin’s design and broader adoption still drive most analysts’ expectations upward. Key takeaways: major holders can still move markets (as seen by the recent price dip), but Bitcoin’s supply is finite and demand (via ETFs, institutions, etc.) continues to grow. This event will likely induce short-term caution, but it may also clear the way for fresh buyers at lower levels.
What do you think of this development? Join the discussion: is this whale sell-off a red flag or a buying opportunity? Share your thoughts below and let the Binance Square community know.
#CryptoScamSurge #AmericaAIActionPlan #BTRPreTGE #BNBBreaksATH