

The price of Bitcoin has maintained at $117,914 each on July 26, 2025, pushing its market capitalization to $2.34 trillion with a 24-hour trading volume of $43.60 billion. The daily price fluctuated within a narrow range from $115,086 to $118,102, indicating a battle between buyers and sellers at the short-term resistance level.
Bitcoin
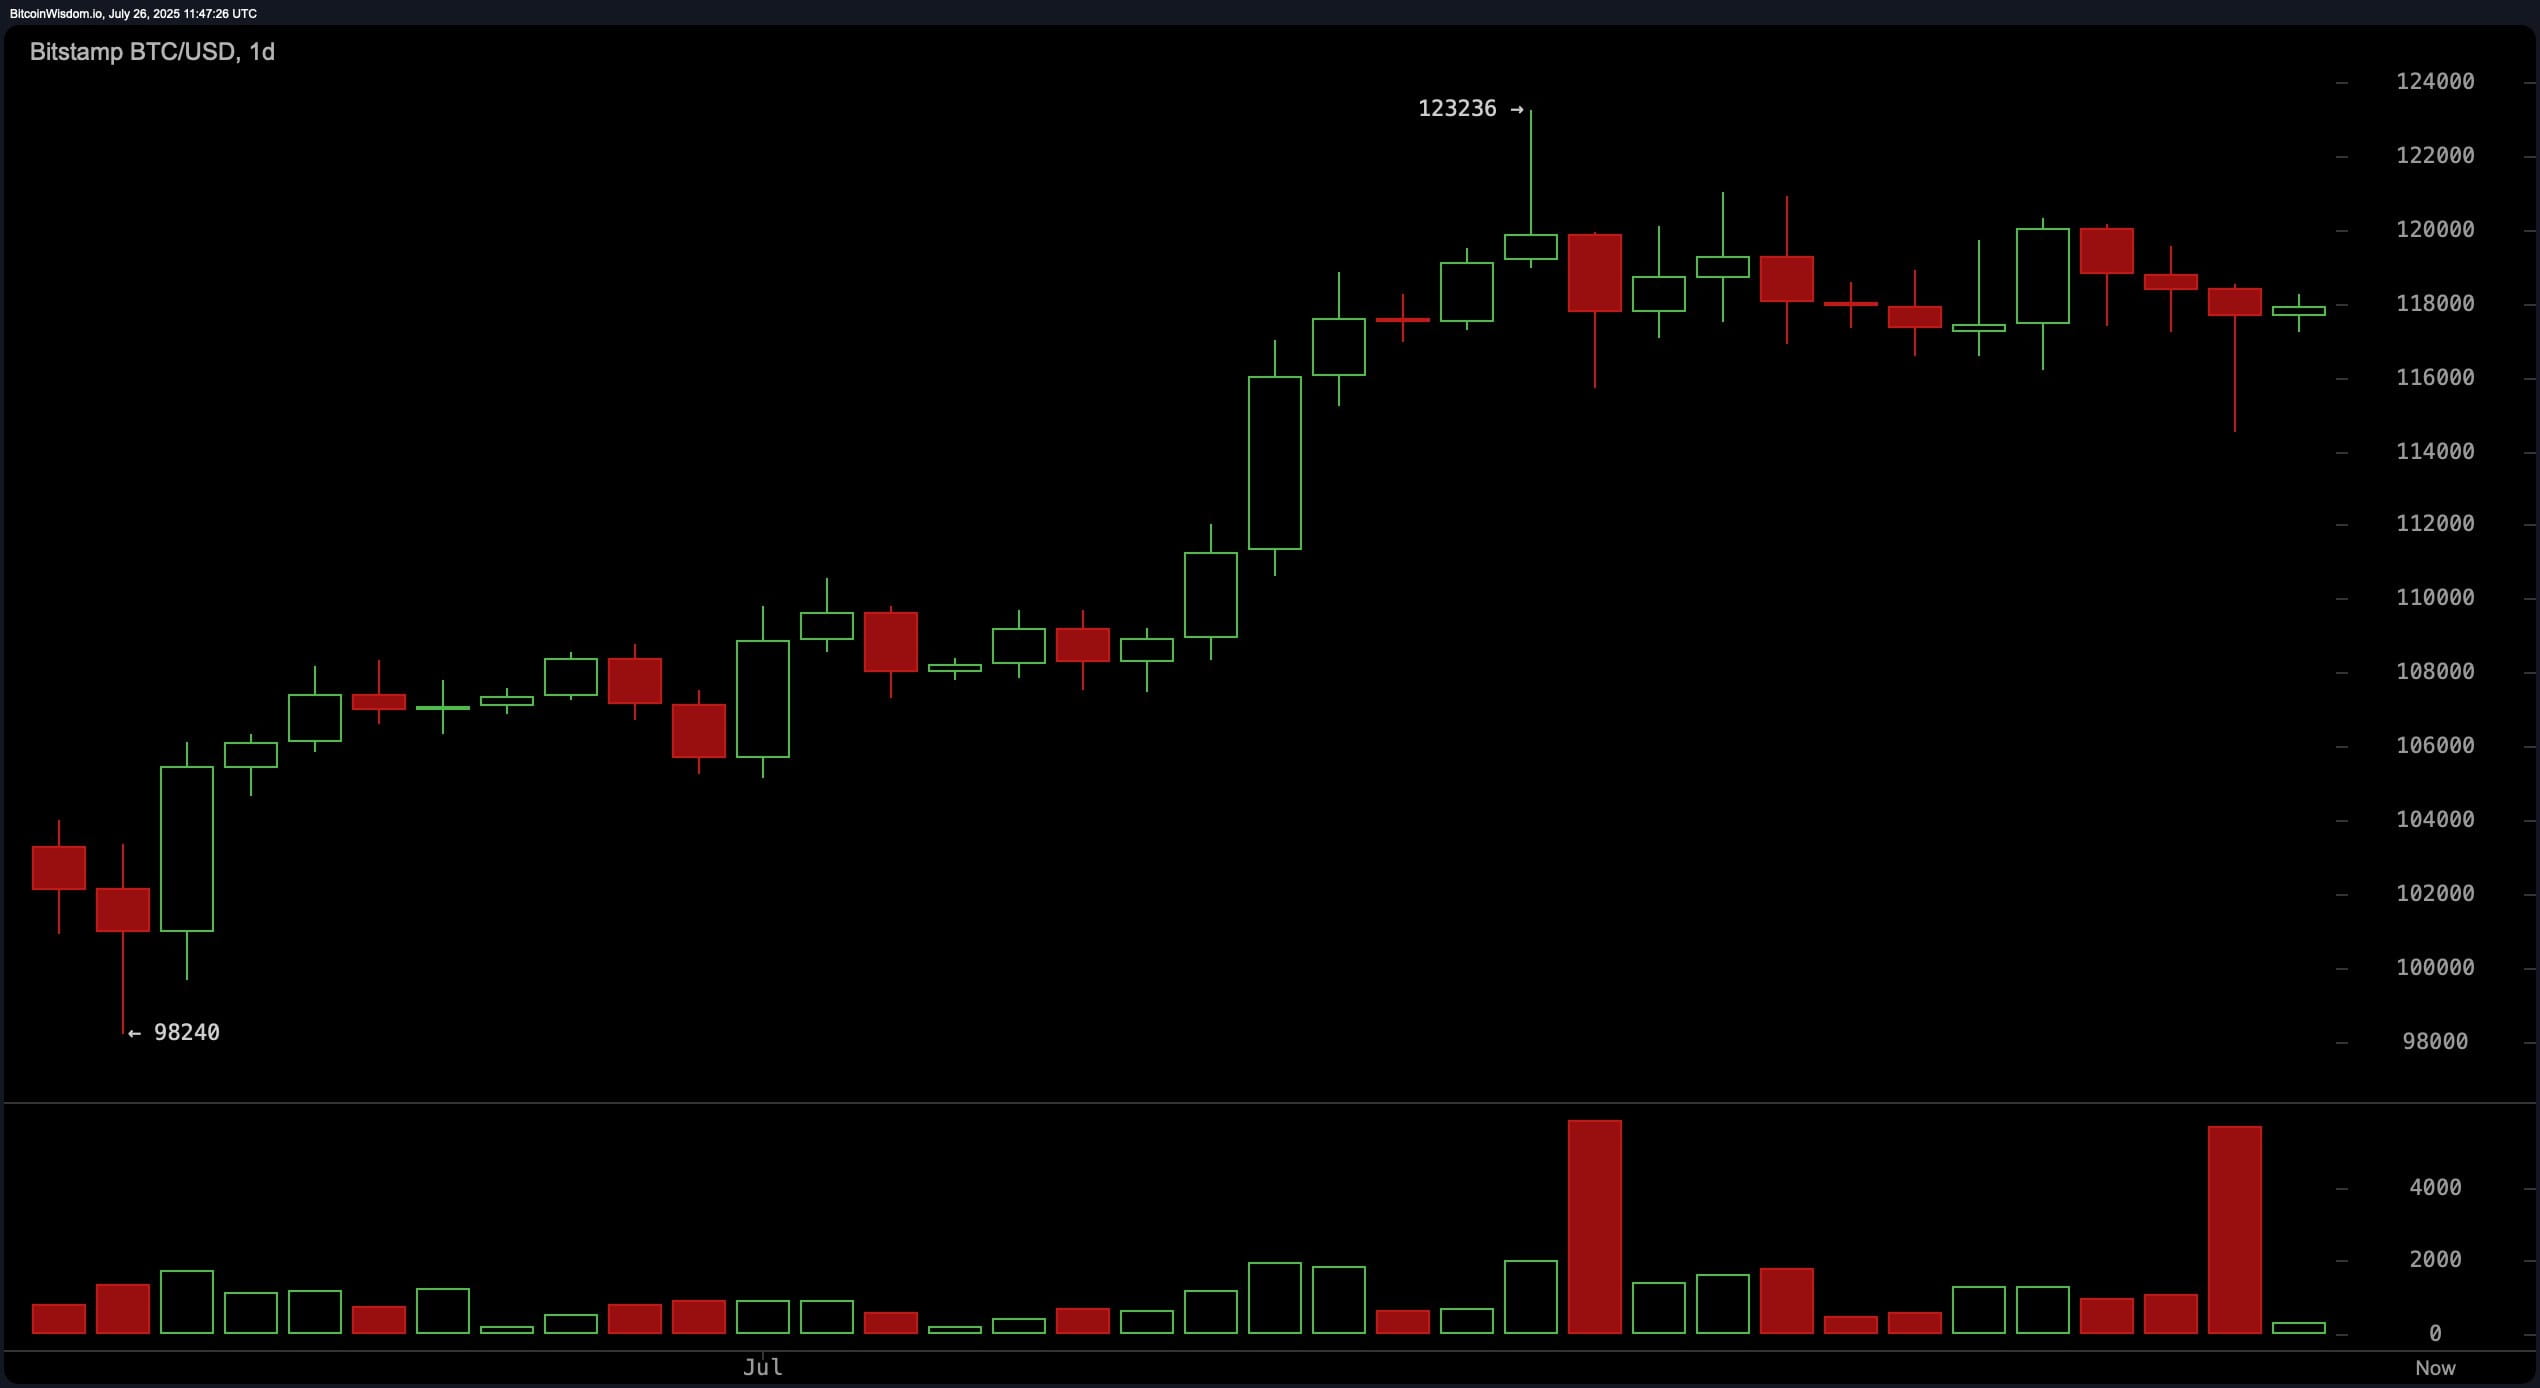
On the daily chart, Bitcoin continues to exhibit a broad bullish trend that has entered a corrective phase after reaching a recent high near $123,200. This narrow range movement indicates investors are taking profits at higher price levels, as seen through a large red candle indicating distribution by institutions. Support remains solid in the $114,000 to $115,000 range, which has been tested multiple times. Traders are looking to open positions in this area, targeting a move back to the resistance zone of $120,000 to $122,000, with risk management below $113,500.
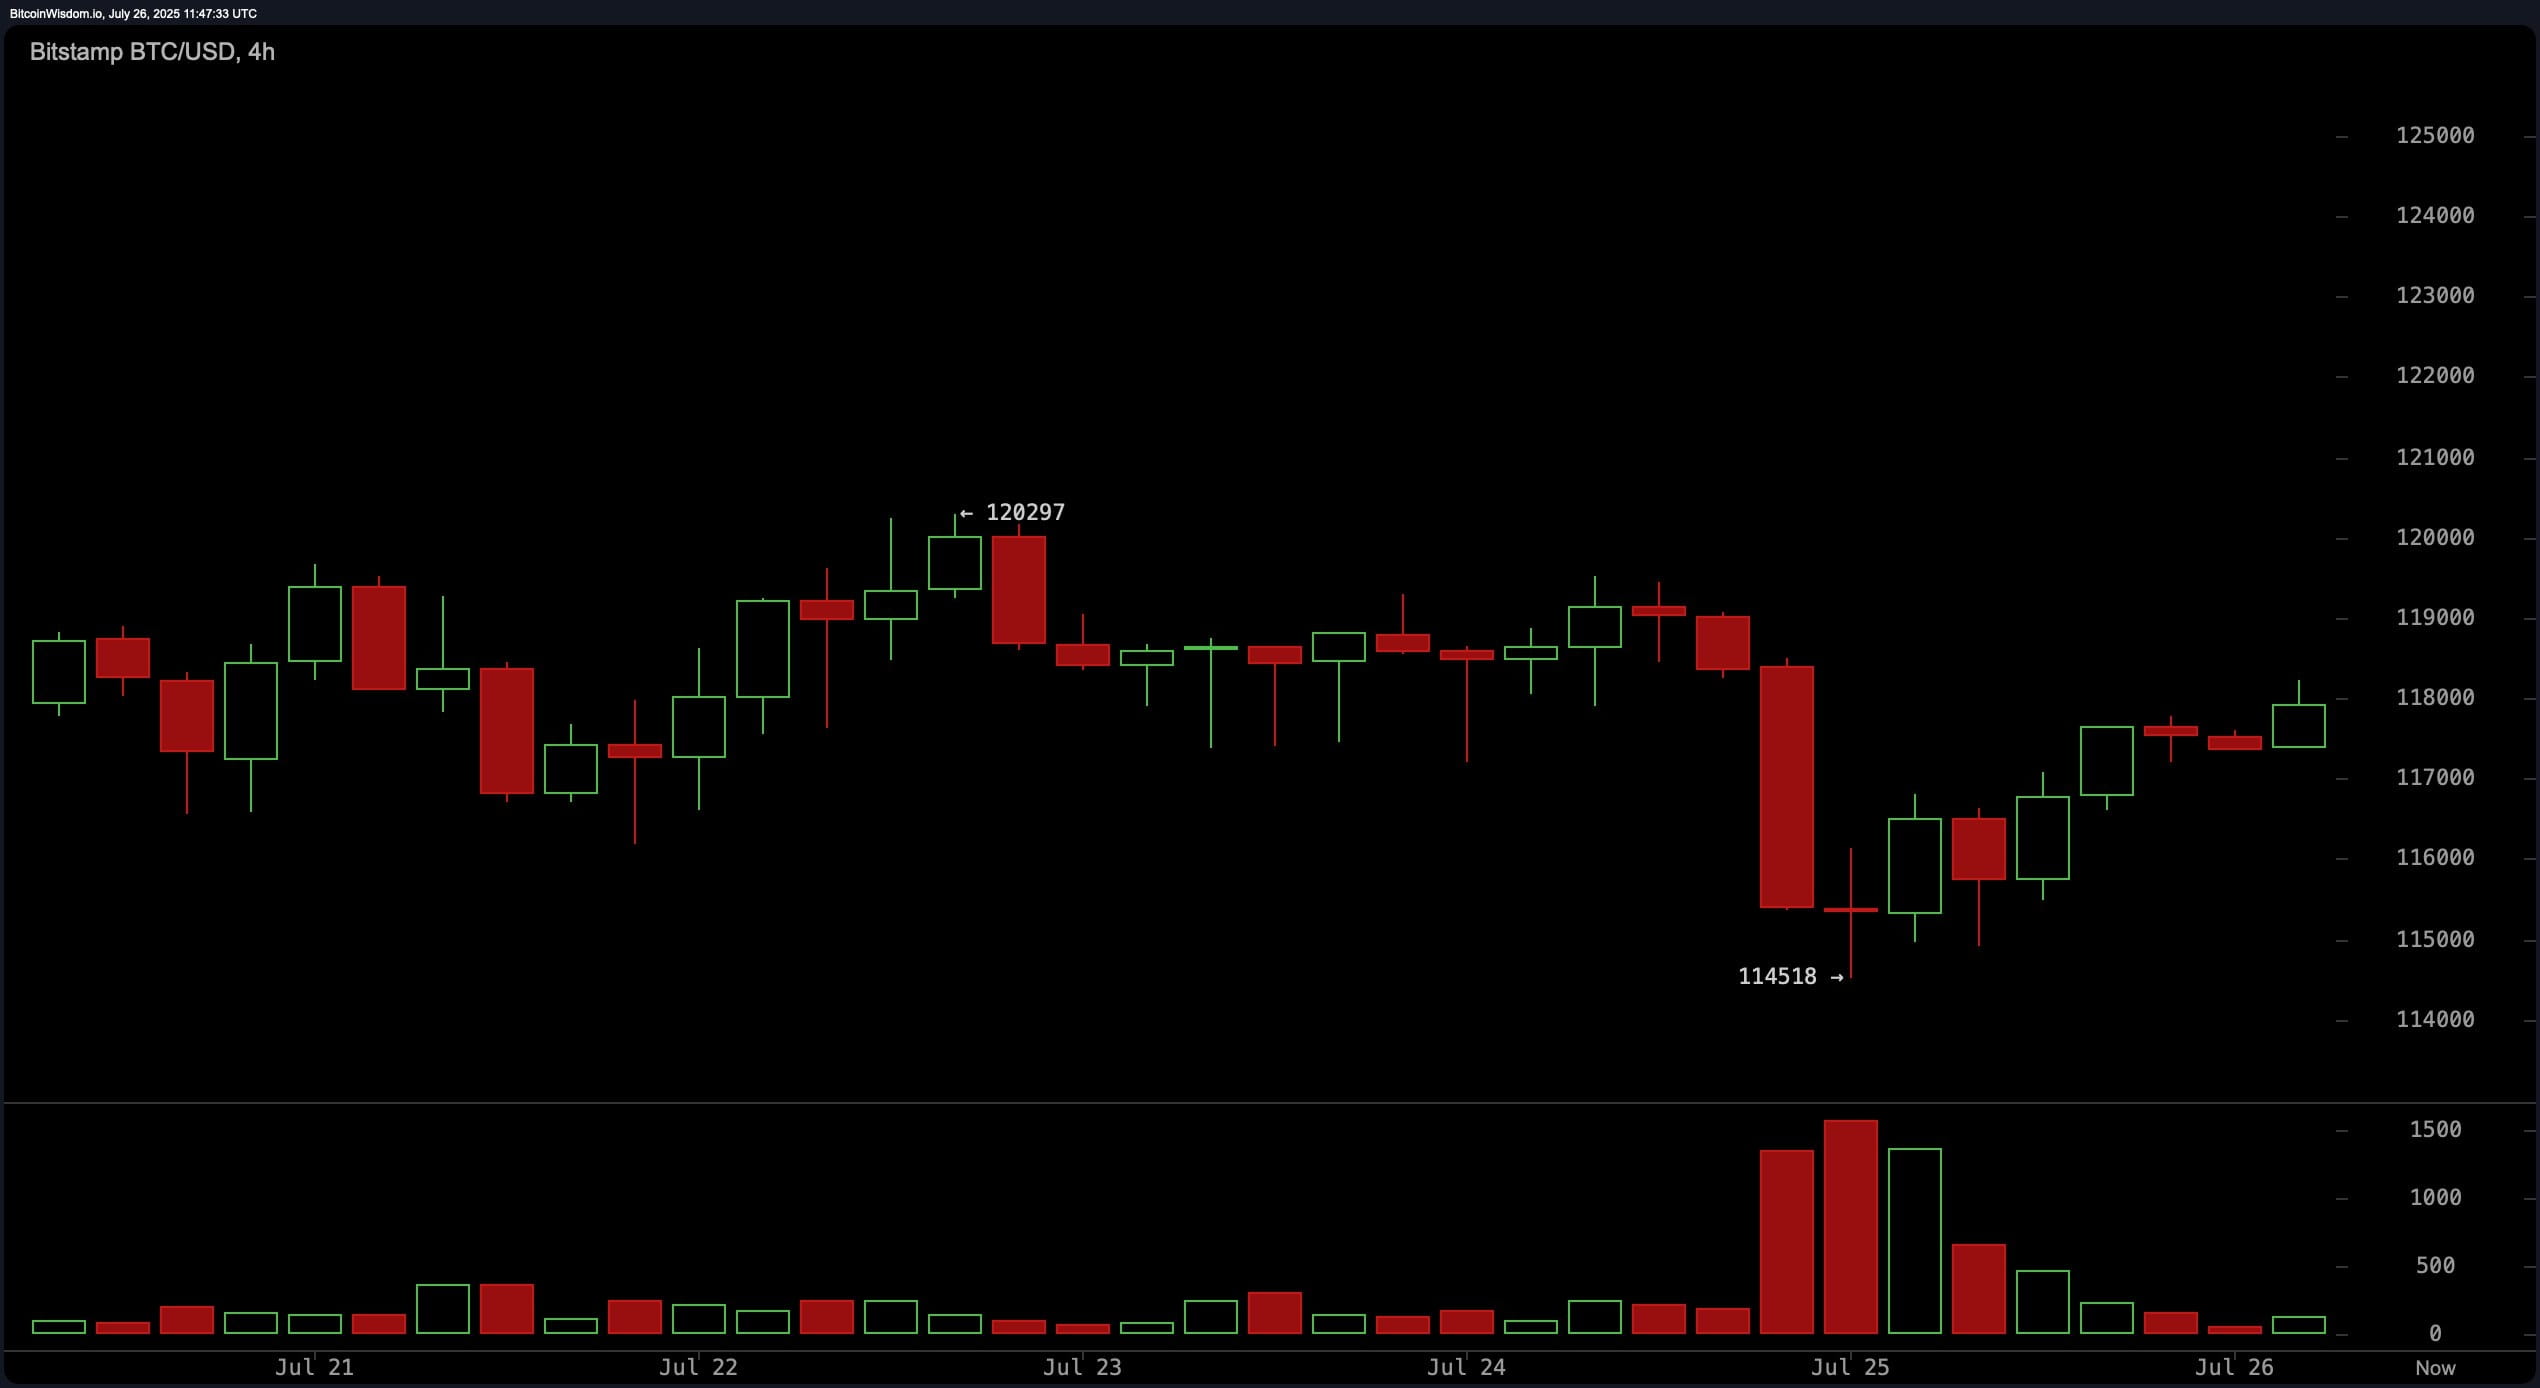
The 4-hour Bitcoin chart illustrates the recent recovery from a sharp decline that bottomed at $114,518. A V-shaped recovery has formed, but the lack of volume confirmation suggests market hesitation. Currently, Bitcoin is testing the $118,000 level, which is immediate resistance. A close above $118,500 with volume could trigger a short-term breakout, while failure at this level could invite selling pressure down to $116,000. The setup favors positioning tactically based on breakout or rejection signals.
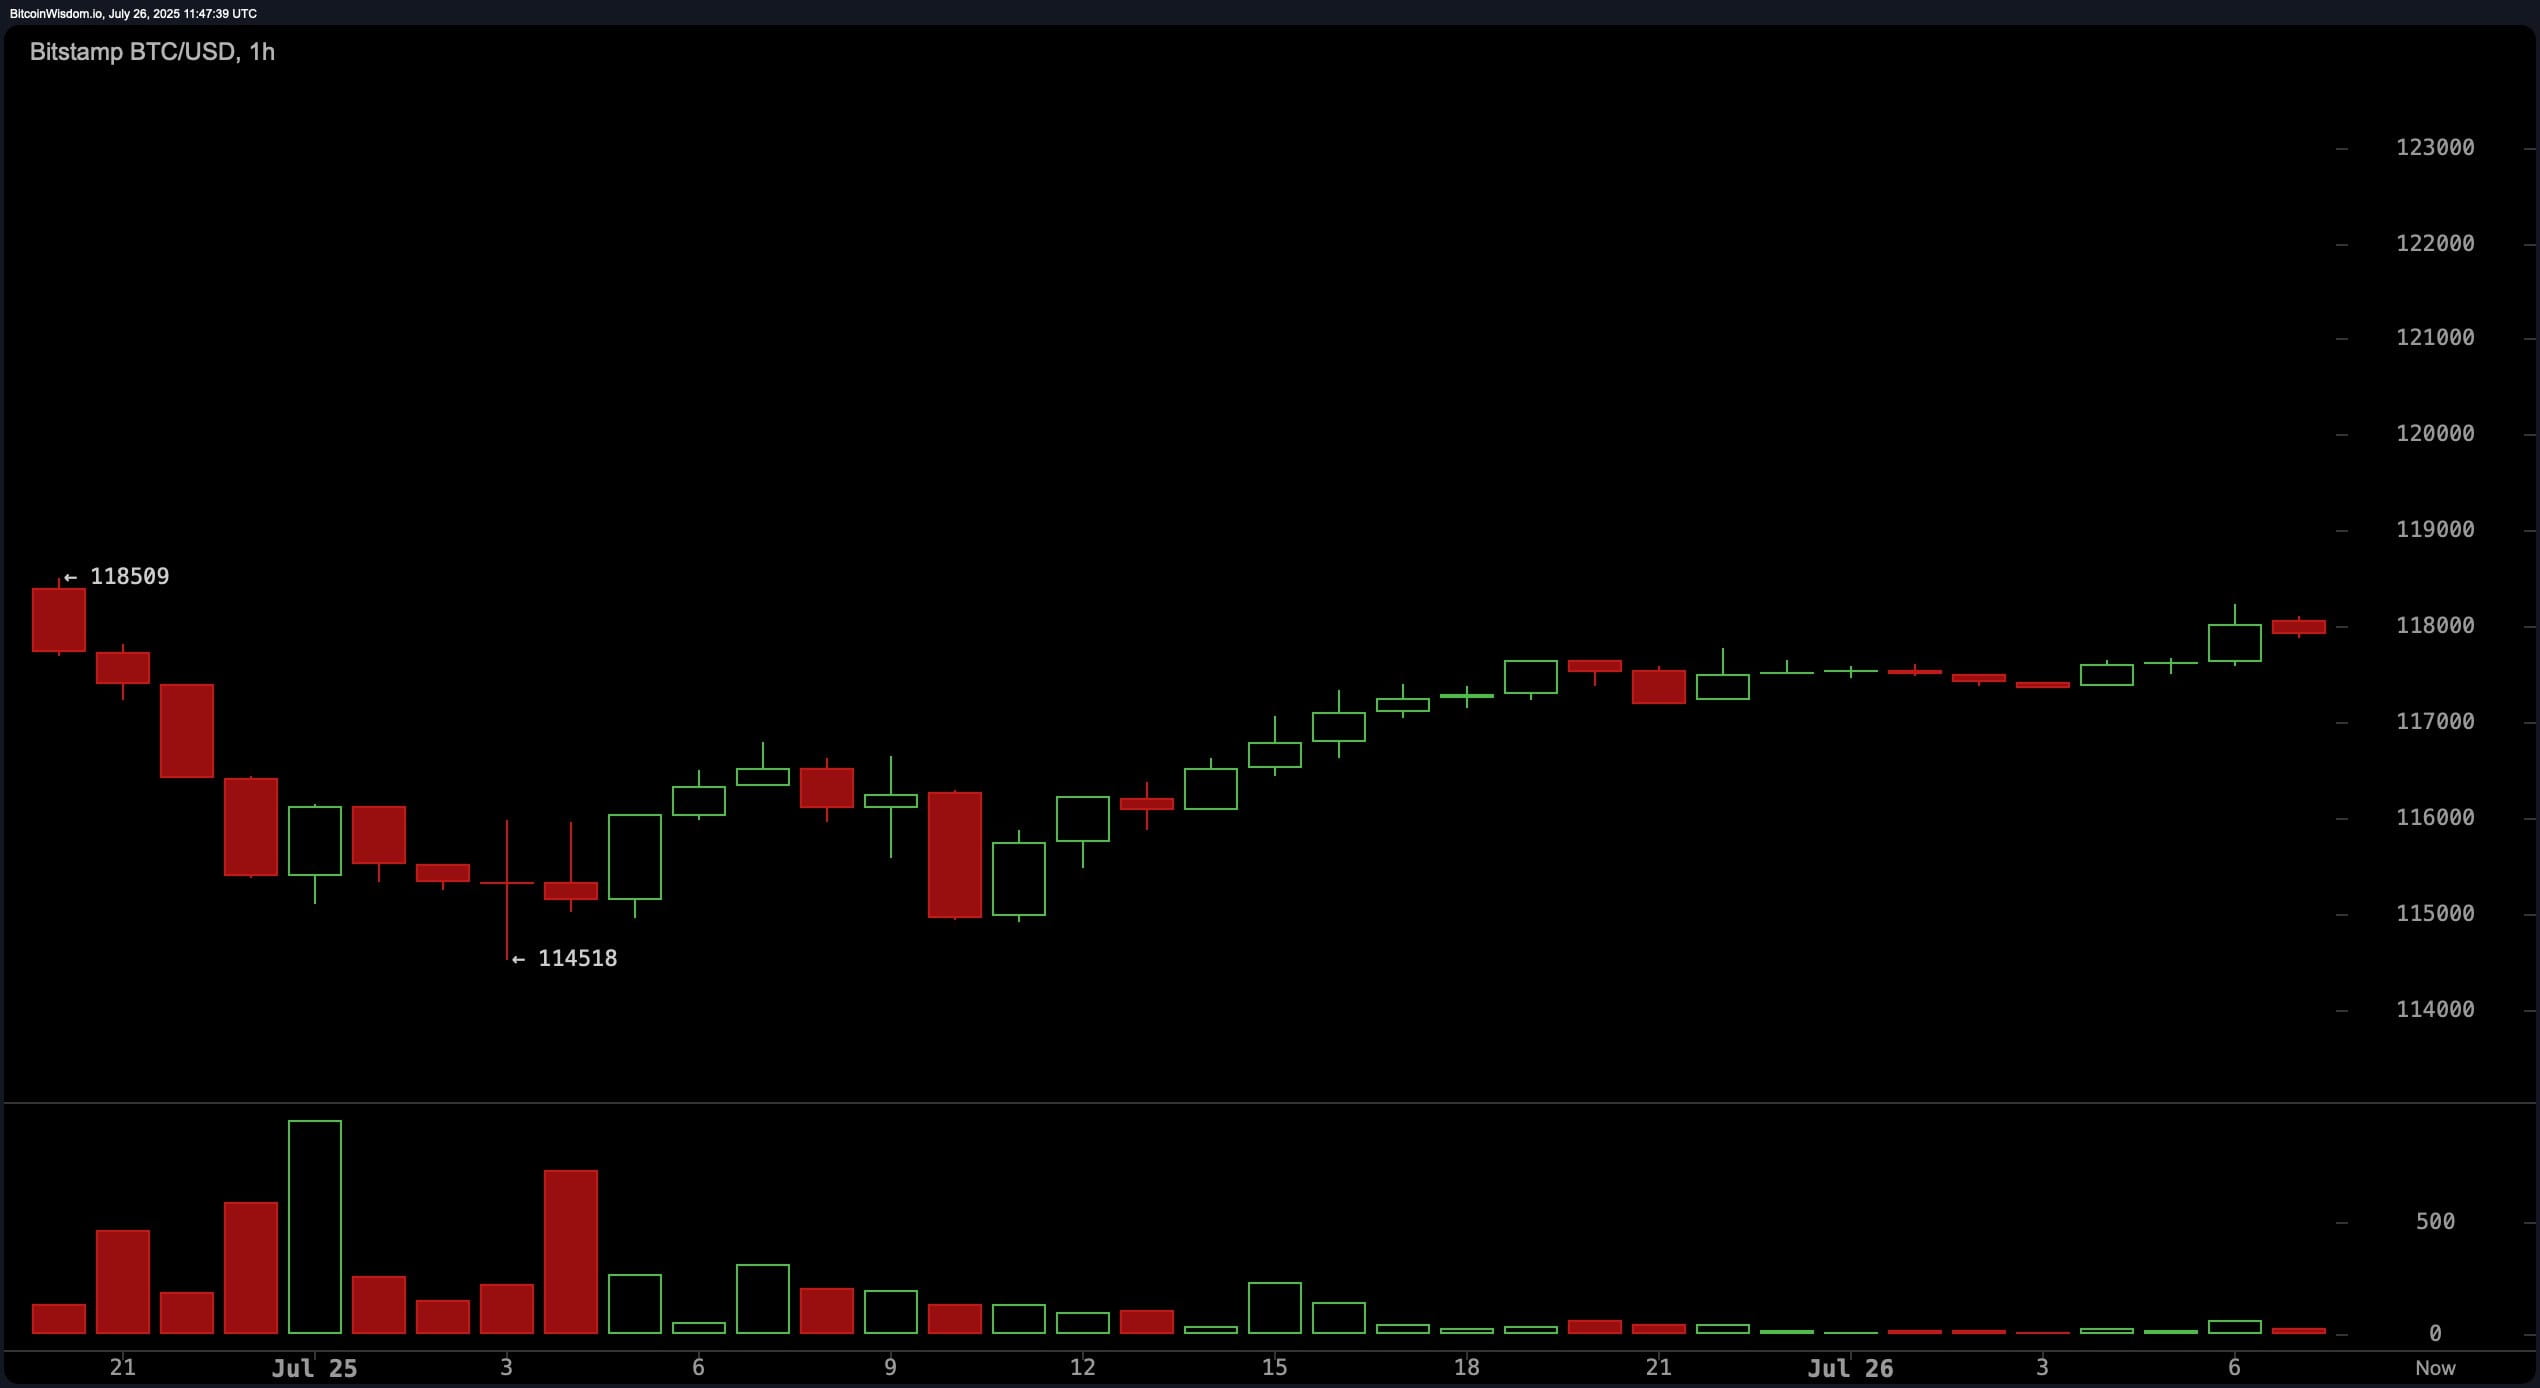
In the 1-hour Bitcoin chart, Bitcoin marked a small bottom at $114,518, initiating a strong rally. However, the failure to break above the lower high of $118,509 suggests short-term exhaustion. Volume has been thin during the current consolidation phase, indicating hesitation. Short-term traders are advised to scalp in the $117,800 to $118,200 range, placing tight stop orders due to the narrow trading range. A clear break above or rejection from $118,200 will determine the next small trend.
From a momentum and trend indicator perspective, oscillators are primarily neutral with a slight bias towards bearish. The Relative Strength Index (RSI), Stochastic Oscillator, Commodity Channel Index (CCI), Average Directional Index (ADX), and Awesome Oscillator all indicate neutral signals. However, the momentum indicator is emitting bearish signals, and the Moving Average Convergence Divergence (MACD) is also in negative territory, which may indicate underlying weakness not yet seen on the price chart.
Although the oscillator signals are neutral, the moving averages (MA) still maintain a decisive bullish stance. Both the Exponential Moving Average (EMA) and Simple Moving Average (SMA) across the 20-day, 30-day, 50-day, 100-day, and 200-day periods support a long-term growth trajectory. The 10-period EMA has turned bullish, while the 10-period SMA has slightly slowed down with a bearish signal. This divergence indicates short-term volatility within a broader bullish trend. Overall, these technical indicators suggest that while Bitcoin is consolidating below resistance, the underlying structure remains constructive for a potential bullish restart if volume returns.
Bullish Assessment:
If Bitcoin maintains support above $114,000 and breaks strongly above $118,500 accompanied by volume, the broader trend supports a continuation towards the resistance zone of $120,000–$123,000. Strong alignment between the long-term simple and exponential moving averages supports the bullish outlook, suggesting accumulation is occurring below the key resistance level.
Price Action Assessment:
If Bitcoin cannot reclaim $118,200 and breaks below the support zone of $114,000, a deeper correction may occur, potentially targeting the $110,000 level. Bearish momentum signals from the momentum indicator and the Moving Average Convergence Divergence (MACD) suggest vulnerability to a bearish shift if the bulls lose control at current levels.
