PEPEUSDT 10 PEPE/TETHER
Chart Analysis:
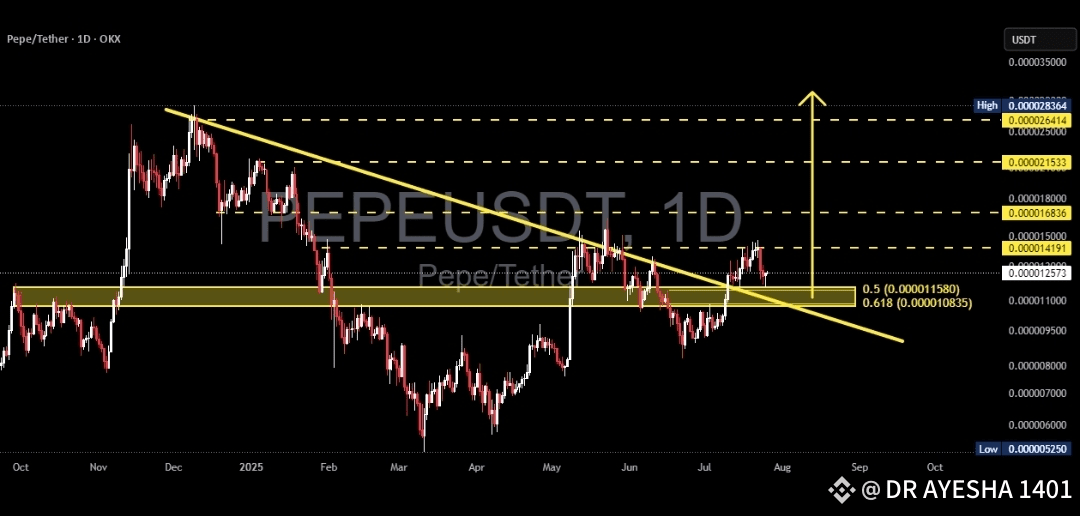
On this daily timeframe chart of PEPEUSDT, price has successfully broken above the descending trendline that had capped the price since late 2024. This breakout is a strong early signal that bearish momentum is weakening and a potential trend reversal may be underway.
After the breakout, the price is now performing a retest at a key confluence support zone, including:
Fibonacci Retracement levels 0.5 (0.000011580) and 0.618 (0.000010835) the Golden Zone Previous horizontal demand zone (highlighted in yellow) Retest of the broken descending trendline This retest area will be crucial for determining the next directional move.
Bullish Scenario:
If price holds above the Fibonacci Golden Zone and forms a bullish confirmation candle, we could see a continuation of the uptrend toward:
0.000014191
0.000015000
0.000016836
0.000021533 (medium-term target) Possibly retesting the High at 0.000028364 This would confirm the start of a major trend reversal and renewed bullish momentum.
Bearish Scenario:
If price fails to hold above the 0.000010835 level and breaks down below the Golden Zone:
Expect a drop toward psychological support around 0.000010000 And potentially further down to the strong support near 0.000007000 Such a move would invalidate the breakout and put PEPE back into a consolidation or extended downtrend phase.
Chart Pattern Notes:
Descending Trendline BreakoutGolden Zone Retest (Fibonacci 0.5 & 0.618)Potential formation of an Inverted Head & Shoulders pattern (in early stages)
Conclusion:
PEPEUSDT is at a critical turning point after breaking out of a long-term downtrend.
If the support at the Golden Zone holds, there is strong potential for a sustained bullish rally. However, traders should remain cautious and apply proper risk management in case of a breakdown below key levels.
$PEPE DYOR