
Date: Fri, July 25, 2025 | 04:50 AM GMT
The cryptocurrency market is experiencing a bout of volatility after a strong multi-week rally, with Ethereum (ETH) pulling back to $3,600 from a recent high of $3,875. While most top altcoins are feeling the pressure, Ethena (ENA) continues to show resilience — notching 3% gains today and extending its monthly rally to an impressive 89%.
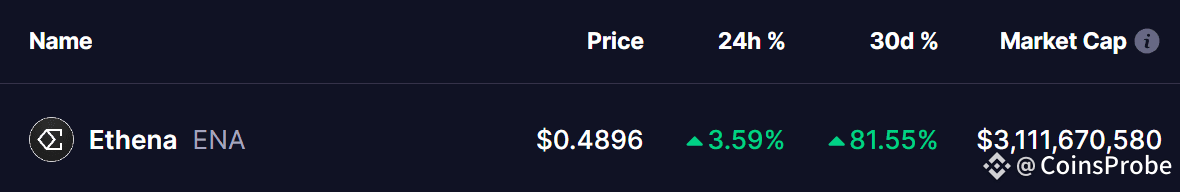
Source: Coinmarketcap
Beyond the price action, ENA’s daily chart is flashing a potentially bullish fractal pattern — one that closely mirrors its breakout structure from late 2024.
Familiar Fractal Signals Bullish Continuation
On the daily timeframe, $ENA is forming a near-identical pattern to the one it built during its 2024 surge — a setup that fueled a remarkable 168% rally.
In that previous move, ENA carved out a textbook double-bottom reversal pattern, confirmed by a breakout from a falling wedge. Once the breakout took place, ENA cleared its 200-day moving average and rallied all the way to test its neckline resistance, soaring by 168% along the way.
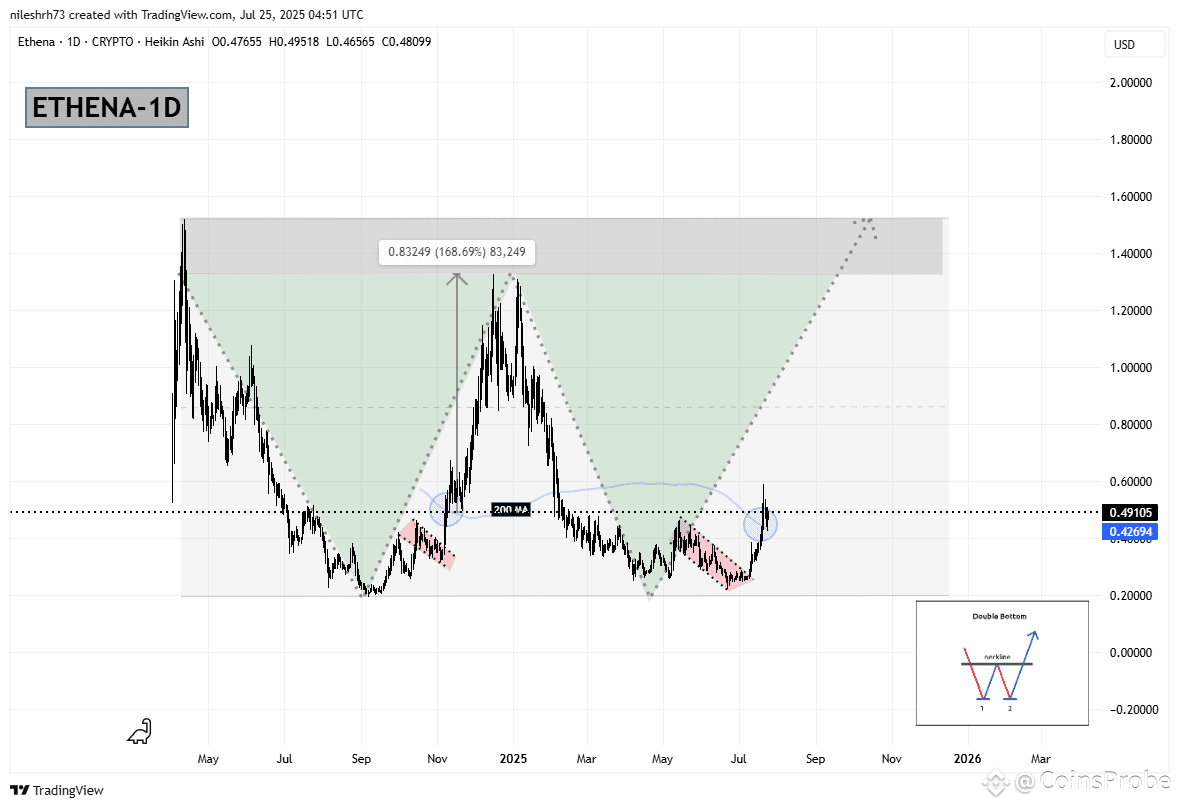
Ethena (ENA) Daily Chart/Coinsprobe (Source: Tradingview)
Now, history seems to be repeating itself. ENA has once again established a V bottom, followed by another falling wedge breakout, which has already pushed it above the critical 200-day moving average.
What’s Next for ENA?
If this fractal continues to play out, ENA may consolidate near its 200-day moving average support around $0.4269 — a phase marked by the blue circle on the chart, similar to its 2024 trajectory. If this support holds, ENA could be primed for a sharp rally, potentially targeting its neckline resistance near $1.33. Such a move would represent roughly 170% upside from current levels.
For now, holding the 200-day moving average remains the key for this bullish fractal to stay valid.
Disclaimer: This article is for informational purposes only and not financial advice. Always conduct your own research before investing in cryptocurrencies.


