Having been in the crypto space for ten years and actively trading for six years, with more than 3100 days of experience, I have engaged in long-term, short-term, ultra-short, and swing trading, having tried nearly every type of method, so I have a fair amount of authority on this issue.
I have always said that mastering a skill is a ten-thousand-hour rule. If you work eight hours a day and review for more than 200 days a year, it will take about five years to stabilize profits. There must be significant pitfalls within ten years, so to be safe, do not place your principal beyond your capability within that timeframe.
Many experts who have traded from tens of thousands to tens of millions or billions simply use contracts with very high multiples. As a result, many have suffered losses in a bear market, but you just don't know it. Human nature, in the face of significant trends, often leads people to lose their ability to make correct judgments.
In the crypto space, some obscure knowledge or small tips may seem insignificant but are actually quite important. Today we'll discuss a few:
Cost averaging is actually not that simple
For example, if you invested 10,000 U when the coin price was at 10 U, and later the price dropped to 5 U, and you added another 10,000 U. At this point, your average cost is 6.67 U, not the 7.5 U that many people might think. This situation is quite common in the market, and understanding this cost calculation is quite helpful for managing positions.
The compounding effect is really quite frightening
Assuming you have 100,000 U, earning 1% daily and then stopping. If you can stick to it for a year with 250 trading days, your assets could grow to 1,323,200 U by the end of the year. If you persist for another two years, your assets could exceed ten million. Of course, this is based on stable returns, and the challenge lies in maintaining this compounded growth.
Probability, take profit and stop loss, there are nuances here
Assuming you invest with a 60% probability of winning, earning 10% each time you exit and stopping loss at 10%. By doing this for 100 times, the total return could reach 300%. But the premise is that you must strictly adhere to the trading plan and not be swayed by market fluctuations, especially during large market swings, you must remain calm.
Greed is the biggest stumbling block
For example, if you start with 10,000 U and earn 10% each time, after 49 days your assets could exceed a million, after 73 days it could exceed ten million, and after 97 days it might even reach a billion. But in reality, very few people can achieve this, as most cannot control their greed and ultimately end up losing. This is also why many traders earn money but cannot hold onto it.
Contract trading and position management
In contract trading, position and capital management are crucial. Many people like to use 20%-30% of their principal to open positions, but I personally prefer to use only 2%-5%, then leverage by 20 times. This way, the risk is controllable, and large fluctuations won't throw you off balance.
The seven iron rules for trading in the crypto space!
1. For strong coins, if they drop for nine consecutive days, be sure to follow up in a timely manner.
2. Any coin that rises for two consecutive days must be promptly reduced in position.
3. Any coin that rises more than 7% has the opportunity to continue rising the next day, so you can continue to observe.
4. For strong bull coins, be sure to wait until the pullback is over before entering.
5. If any coin experiences three consecutive days of low volatility, observe for another three days; if there is no change, consider switching coins.
6. If any coin fails to recover its cost price the next day, it should exit promptly.
7. If there are three on the rise list, there must be five; if there are five, there must be seven. For coins that have risen for two consecutive days, they should be bought on dips, and the fifth day is usually a good selling point.
There is a 'foolproof' way to trade coins, following the market makers is very simple! Sharing with those who see this article.
Do you know how to trade using the best fractal trading strategy? This fractal trading strategy will answer all your questions about fractals. You will learn step by step how to use this strategy for stable profitable trades.
Today, we will delve into a strategy using the Bill Williams Fractal Indicator / Bill Williams Alligator.
Before we begin to use the fractal strategy for profitable trading, I would like to introduce some background information about Bill Williams himself. This will help you understand the significance of these special indicators. It is also recommended that you read about 'adding to positions' and 'reducing positions' in trading.
Overview: Mastering Bill Williams' fractal trading methods
Bill Williams is a renowned Wall Street trading master, who was previously a psychotherapist and the founder of Profitunity Trading Group, with over 49 years of trading experience (1932-2019). His theoretical themes cover Elliott Wave fractal structures, money flow index, and wise trading methods among others.
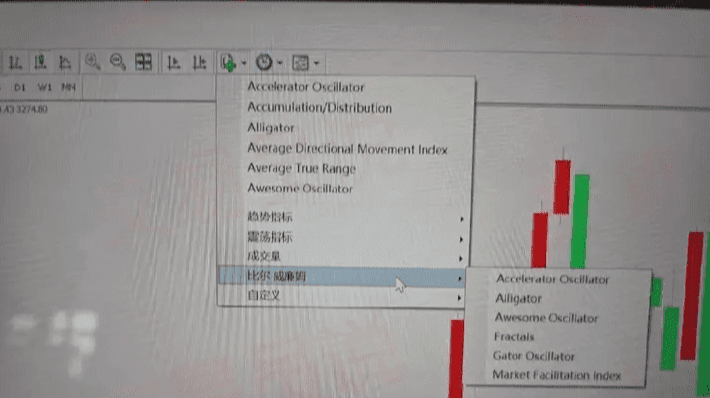
Bill Williams has deep knowledge of the stock, commodity, and forex markets, which has led him to develop many technical indicators, including the Acceleration/Deceleration Oscillator, Alligator, Awesome Oscillator, Fractals, Gator Oscillator, and Market Facilitation Index, among others.
Each indicator has its specific value. If you can understand the basic concepts of each indicator, they are very useful tools in trading.
His market view is: If you want to make money through trading, you must be able to understand the fundamental structure of the market. You also need to understand the internal components of the market, which he refers to as 'dimensions'.
These 'dimensions' include the following aspects:
Fractals (phase space)
Area (combination of relative energy and strength)
Momentum (relative energy)
Deceleration/Acceleration (relative strength)
Balance Line (strange attractor)
There is much more to say about Bill Williams, but the most important point is that his market analysis and perspective are unique. While some claim these powerful indicators are outdated, in reality, they are still very effective when you apply the right strategy.
His indicators are equipped by default on most trading platforms. These indicators are usually categorized under his name 'Bill Williams' or 'Williams'.
Unleashing the power of 'Fractal Breakout': Key indicators for trading success
Bill Williams Fractal Indicator: How to Use Fractals in Trading?
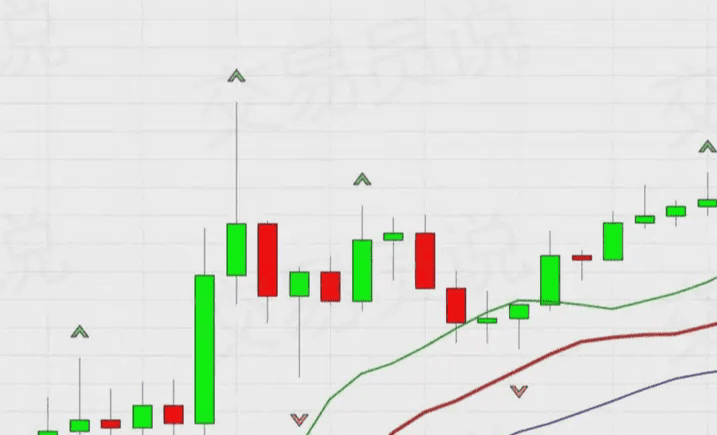
The fractals shown in the following figure are actually the arrows above or below the candlesticks on the chart. These fractals are formed when five consecutive candlesticks are arranged in a specific way. You need to wait for the fifth candlestick to close to determine if a high or low point has occurred in this set of candlesticks.
We will further detail this fractal indicator and teach you how to use the 'Alligator Line Indicator'. You can find the fractal indicator on MT4 or other mainstream trading platforms. No need to download additional fractal indicator plugins, as it is already pre-installed on the platform.
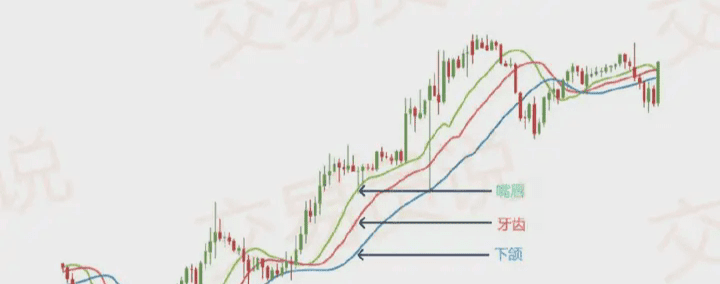
Bill Williams Alligator Indicator: How does it work? This indicator consists of three specific moving averages:
1. The 13-period moving average is called 'Jaw' (blue)
2. The 8-period moving average is called 'Teeth' (red)
3. The 5-period moving average is called 'Lips' (green)
We will delve deeper into this indicator later. The reason for naming these three lines separately is that we will frequently reference them in the strategy.
Below is what the Alligator lines look like:
The above indicators are just two of the five indicators developed by Bill Williams.
As shown in the image above, these are all five powerful indicators that come with Bill Williams on most trading platforms.
I do indeed like each of these 5 indicators, but after extensive research and testing, I found that combining the Alligator line with the fractal indicator is not only the simplest way to use these indicators but also, under the guidance of the correct strategy, they are very powerful.
Now, let's delve deeper into what fractal structure patterns are.
What are fractals in trading?
Williams' fractals are reversal points on the price chart, namely swing highs and swing lows. As mentioned, the fractal shape is a structure composed of five consecutive candlesticks, where:
The middle candlestick is the highest point
Or, the middle candlestick is the lowest point
There are two candlesticks on each side of the middle candlestick. Note that if the middle candlestick is the highest (or lowest) point among these five candlesticks, the fractal indicator will display an arrow above (or below) it.
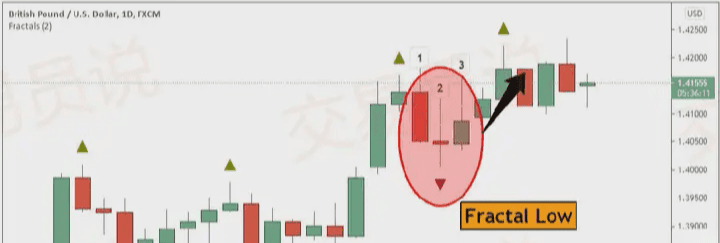
Note: According to Bill Williams' work (Trading Chaos), a fractal can also be a structure composed of 3 candlesticks, where the middle candlestick is the highest or lowest among the three.
As a general rule, a fractal requires at least 3 candlesticks to form.
If you are a day trader or scalper, then you should use fractal structures composed of 3 candlesticks.
Below is an example of a low fractal composed of 3 candlesticks:
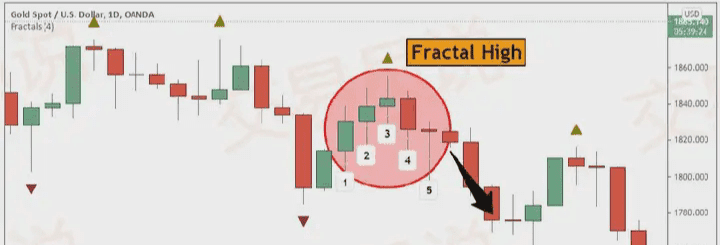
However, if you are a swing trader, we recommend using higher fractal settings.
You can use any odd number as the fractal length, such as 5, 7, 9, etc.
Below is an example of a high fractal composed of 5 candlesticks:
Although Williams' fractals rely more on visual recognition than on underlying mathematical formulas, for those who want to delve deeper, here is how the fractals are calculated.
Understanding the formulas behind the fractal indicators
The calculation of fractal indicators involves multiple 'if condition checks'.
For a fractal swing high, we use the following formula:
High (N) > High (N−2) and
High (N) > High (N−1) and
High (N) > High (N+1) and
High (N) > High (N+2)
For a fractal swing low, we use the following formula:
Low (N) < Low (N−2) and
Low (N) < Low (N−1) and
Low (N) < Low (N+1) and
Low (N) < Low (N+2)
Where N represents the highest or lowest price of the current candlestick.
How to trade using fractal indicators?
Simplified Fractal Trading: A Beginner's Guide to Bill Williams Fractal Indicator
The basic fractal trading strategy is actually very simple.
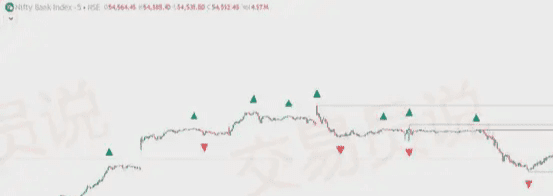
On most trading platforms, fractal arrows appearing above the price are green, indicating a potential high point (swing high) is forming.
In this case, the high point of this candlestick may indicate a potential resistance level.
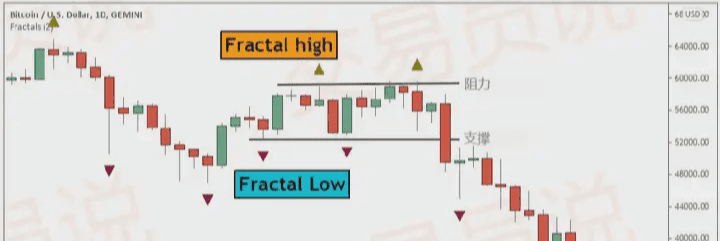
Conversely, fractal arrows appearing below the price are red, indicating that a potential low point (swing low) is forming or that a key price level is about to form.
In this case, the low point of this candlestick may indicate a potential support level.
This fractal trading system is indeed very effective in identifying short-term swing highs and lows.
Based on these trading principles, we have developed a Bill Williams trading system that can issue low-risk entry signals.
Fractal trading strategy steps: Fractal trading technical guide
Step #1: Apply both the 'Fractal Indicator' and the 'Bill Williams Alligator Indicator' on the chart simultaneously.
The first step is, of course, to load these important indicators onto your charts. As I mentioned earlier, these indicators are built into every trading platform I know, so this step should be very simple for you.
Once you have added them, your chart will look like this:
Step 2: Trading Bill Williams Fractals: Identify where the fractals appear (above or below the Alligator teeth)
Note**: In this example, we are adopting a buy trading strategy, so all the following rules apply to buy trades.
Now let's take a closer look at the true meaning of fractals.
Fractals indicate either a top or a bottom. The most basic fractal indicator consists of at least 5 candlesticks. Therefore, when you see a fractal on the chart, it may indicate one of the following scenarios:
At least five consecutive candlesticks must form a fractal structure, where the middle candlestick has the highest high, and each side has two gradually decreasing highs (forming a buy fractal).
When the middle candlestick shows the lowest low, with two gradually increasing lows on each side, at least five consecutive candlesticks form a reversal fractal (that is, forming a sell fractal).
Fractals may also form with just one candlestick appearing on the right, but please note that in this case, the fractal is not yet confirmed because the price trend may break through that level. Therefore, to keep a fractal permanently on the chart, traders must wait for two more candlesticks to form on the right to confirm the fractal.
Fractals have what are called 'high values' and 'low values', usually represented by upward or downward arrows.
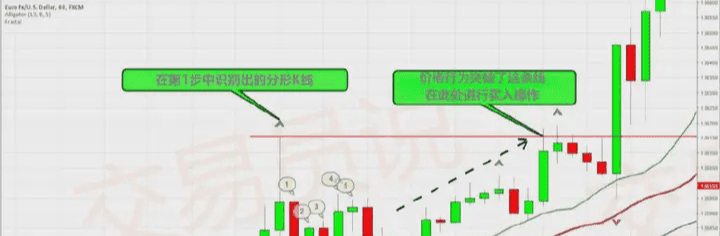
Next, we will explain this fractal breakout trading strategy in detail through specific chart examples.
The above image shows the unique Alligator line indicator. Now you need to pay special attention to the position of the fractals on the candlesticks, especially when combined with this special indicator.
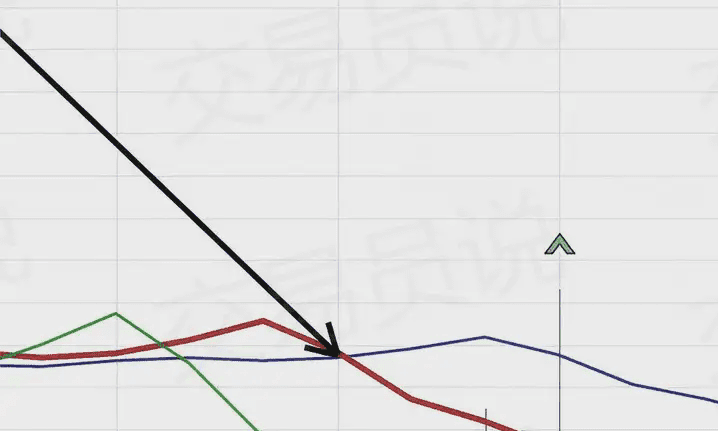
Below is an example of a fractal that we need to pay special attention to:
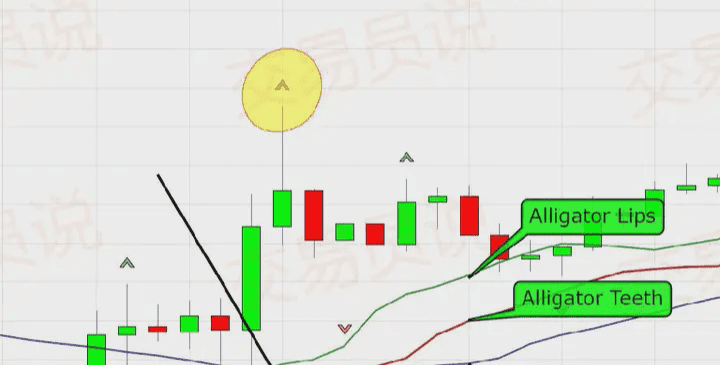
I have drawn a yellow circle around this particular upward fractal. This upward fractal appears on a candlestick that is above the red line (i.e., 'Alligator Teeth'). This is the first criterion for the 'Fractal Breakout' strategy.
In buy trades, fractals must appear on the candlestick above the red line (Alligator Teeth).
What happens here is that this new fractal is higher than the previous fractal, thus forming an upward fractal on the chart.
To enter Step 3 (buy trade), the fractal must be an upward fractal and appear above the Alligator teeth line.
Step #3: The price trend must consistently stay above the Alligator teeth for 5 consecutive candlesticks (buy trade)
This is the 'magic' of the entire strategy.
In most cases, when a fractal like the one above appears, the price trend is still 'sideways'. That is, there has not yet been a real breakout in the recent timeframe. You can also combine this with the 'breakthrough triangle strategy' for trading.
This strategy requires waiting for at least five consecutive candlesticks because this duration often signifies:
1. A pullback may be forming;
2. The price may be at the precursor to a reversal;
3. Or the price is still fluctuating in a flat sideways market.
Regardless of the situation, if you are looking for a strong upward trend, these situations are not ideal signals.
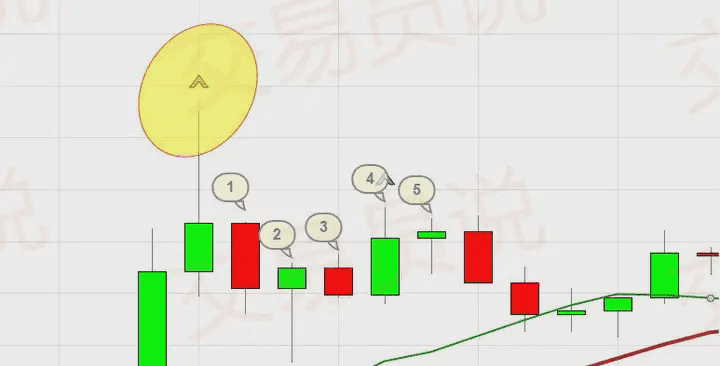
As you can see, during these five candlesticks, the price trend remains stable, with no significant ups and downs. This is exactly the situation that should be observed when using this strategy.
Before we continue to delve into this strategy, let’s clarify what situations could lead to a 'reset' of the strategy, thereby rendering future buy trades invalid:
1. Reset condition: If a sell fractal appears below the Alligator teeth line before opening a position, it will trigger a reset. As shown below:
2. As shown, if this situation occurs in our previous buy trade example, we should deem that buy trade invalid and look for other opportunities. The reason is that this may signal a long-term bearish trend, and if you intend to go long at this point, it is not very wise.
3. Reset condition: If any two lines of the Alligator indicator cross after the fractal candlestick confirmed in Step #1, it will also trigger a reset. As shown below:
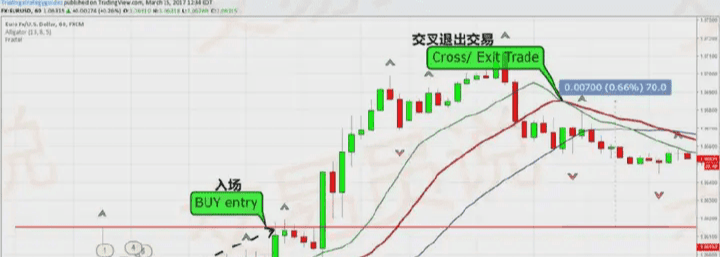
Step 4: The price must break above the fractal candlestick identified in Step 1
Once you see five consecutive candlesticks without a significant drop, and the price consistently stays between the fractal candlestick's high and the Alligator teeth, you can consider placing a pending order.
You can enter using a pending order or enter at market price when the conditions are met; both are valid since the conditions fulfilled are the same.
Illustrated as follows:
As you can see, I marked the fractal candlestick we initially discovered. Next, five or more candlesticks appeared, with prices not falling back near the Alligator teeth line, and the Alligator lines did not cross, ultimately leading to a price breakout above the fractal candlestick high, triggering the trade.
Take profit targets / Stop loss settings
Regarding take profit and stop loss, you can customize this strategy to a certain extent.
Take profit strategy:
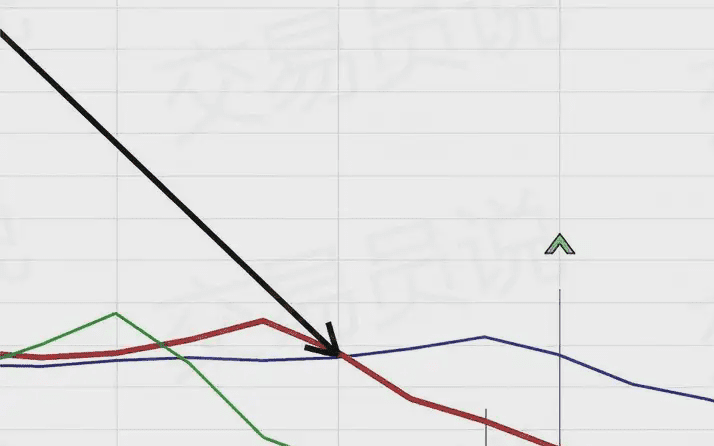
Exit the trade when the two lines of the Alligator indicator cross.
This usually means that the Alligator is preparing to 'go back to sleep', and the price may reverse or enter a consolidation phase.
Following the above operation, this trade could achieve a profit of 70 points.
Stop loss strategy:
Set the stop loss below the previous support/resistance area
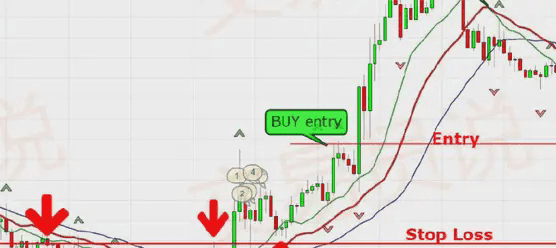
If the price trend turns against you and shifts to a bearish trend, this will provide the best opportunity to salvage the trade. The price may 'bounce' from these areas and return to a bullish direction.
The above are all entry conditions for a buy trade. For a sell trade, simply apply all rules in reverse.
Below are the actual operational steps of the fractal trading strategy:
Practical steps for the fractal trading strategy: Sell trade
1. Step 1: Apply the fractal indicator and the Bill Williams Alligator indicator in the chart
2. Step 2: A downward fractal must appear below the Alligator teeth line, and the price must stay below the Alligator teeth line for five consecutive candlesticks.
3. Step 3: The price must break below the lowest point of the fractal candlestick confirmed in Step #1
4. Step 4: Exit the trade when the two lines of the Alligator indicator cross
Conclusion: The Fractal Trading System
If you have been looking for an excellent trading strategy that can be used in conjunction with these indicators, these basic fractal trading techniques will guide you. Although various strategies can be developed based on these indicators, our practical preference is for this combination of Bill Williams indicators.
Many people believe that all technical indicators are 'lagging' and rarely provide real profitable entry opportunities. The fractal trading strategy incorporates price action analysis, effectively complementing these excellent technical indicators. Therefore, if you are a trader skeptical about indicators, you might try this strategy and let us know your results.
Frequently Asked Questions:
1. What is the fractal trading strategy?
The fractal trading strategy is a technical analysis tool that combines the Bill Williams Fractal Indicator and other technical indicators to identify market trends and potential entry and exit points.
2. How does the Bill Williams Fractal Indicator work?
The Bill Williams Fractal Indicator is used to identify possible reversal points in the market. Its structure consists of five consecutive candlesticks, where the middle candlestick has the highest high (or lowest low), with two lower highs (or higher lows) on each side, thus forming a fractal.
3. What technical indicators are used in the fractal trading strategy?
Key indicators of this strategy include: Bill Williams Fractal Indicator, Alligator Indicator, Awesome Oscillator, and Acceleration/Deceleration Oscillator.
4. What mistakes do traders often make when using fractal trading strategies?
Common mistakes include: relying solely on a single indicator for trading, not correctly identifying market trends, and overtrading.
5. Can the fractal trading strategy be combined with other trading strategies or indicators?
Yes. It can be combined with technical tools such as moving averages, support and resistance levels, Fibonacci retracement, etc., to enhance the strategy's reliability.
6. How can traders maximize profits using fractal trading strategies?
Traders can maximize profits using the fractal trading strategy by combining indicators, accurately identifying trends, confirming signals with other technical analysis tools, and following a clear trading plan.
7. What trading styles is the fractal trading strategy suitable for?
This strategy can be applied to day trading, swing trading, and long-term investing, and can be adjusted according to the trader's preferences and goals.
8. Can beginners use the fractal trading strategy?
Yes. Even novice traders with less experience can use it, but it may take more time to learn the basics of technical analysis and the use of related indicators.
9. What resources are available to help further learn and master the fractal trading strategy?
There are many resources that can help further learn and master the fractal trading strategy, including books, online courses, and trading communities and forums.
10. Which platforms and brokers support fractal trading strategies?
Currently, most trading platforms and brokers support the fractal trading strategy, including MetaTrader 4/5, TradingView, and Interactive Brokers. Traders should research different platforms and brokers to find the ones that best meet their needs and preferences.
In this process, I summarized six important experiences. Although simple, they are very practical.
Focus on strong coins: When trading coins, focus on those that perform strongly. If unsure, look at the 60-day moving average, enter or add to positions above the line, and exit promptly below the line. This trick usually works most of the time.
Avoid chasing highs: when the coin price rises more than 50% in one go, do not rush to enter the market, as it can easily lead to panic. Buying at lower levels is often more prudent, carries less risk, and usually has greater profit potential.
Identify bullish signals: Before a major rise, there are usually some precursors, such as prices fluctuating 10% to 20% within a small range, but with relatively low trading volume. At this point, you can gradually buy in at lower levels, often able to ride the upward trend.
Seize new hotspots: When the market presents new hotspots, the first few days are usually very hot. Following the footsteps of major funds often leads to easy profits.
Stay calm in a bear market: when a bear market arrives, keep your hand steady, preferably not moving for at least half a year. Try to trade less in poor market conditions, learn to rest, as that is the mark of a skilled crypto trader.
Regularly review and adjust the strategy: You should review your operations weekly, not just looking at how much you earned, but evaluating whether your strategy is correct. If it is correct, persist; if not, adjust in a timely manner. After a few months, the trading strategy will become increasingly robust.
Remember, success is not accidental; it belongs to those who are always prepared!
The old master only does real trading, and the team still has positions to take on the speed