1. Analyzing the BTC chart in the 2H frame – Very strong buying power after the correction
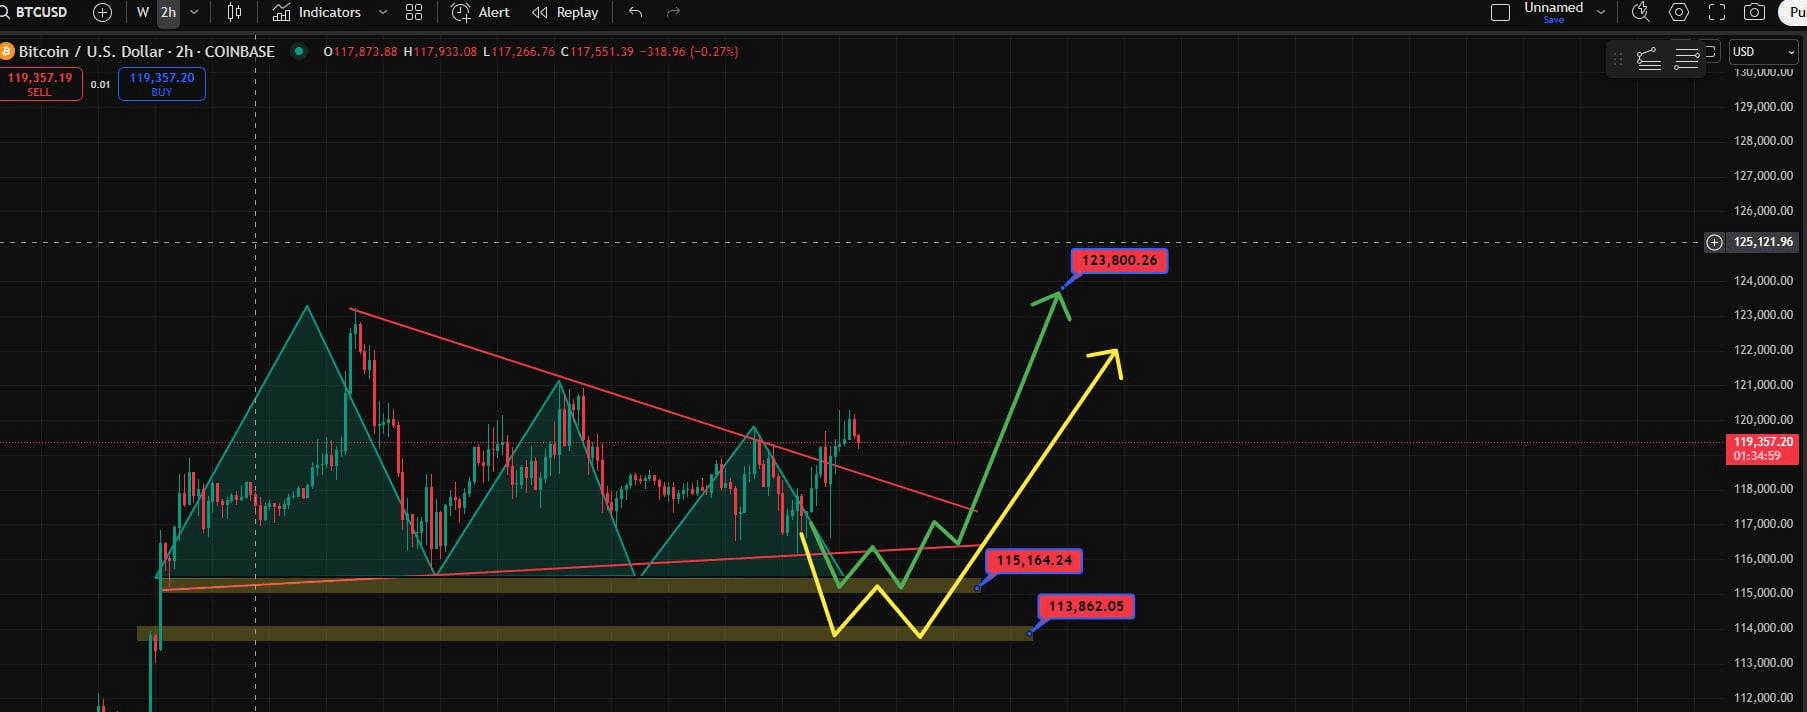
In the 2H timeframe, BTC has formed a accumulating triangle pattern with a downward resistance line. After the accumulation process, the price broke the upper side of the pattern and is expected to undergo a correction to the support area around 115,500 USD as per the original plan. (as you know, I usually provide the 1D frame and above due to high reliability)
📌 However, BTC can only adjust to the 116,000 USD area and then immediately bounce back very quickly. This shows that buying pressure is very strong – the bulls did not let the price reach the ideal buying area but acted early and absorbed selling pressure at a higher price.
🎯 The next target is identified around 123,800 USD, with breakout confirmed by strong volume and closing candles in the 1D frame today above 119k.
2. BTC Dominance (BTC.D) – Increasing to attract money flow, Altcoins are still unable to break out
Although BTC has increased impressively, most Altcoins have not followed suit. The reason lies in the BTC Dominance index is rising again, indicating that funds are focusing on BTC and pulling out from Altcoins.
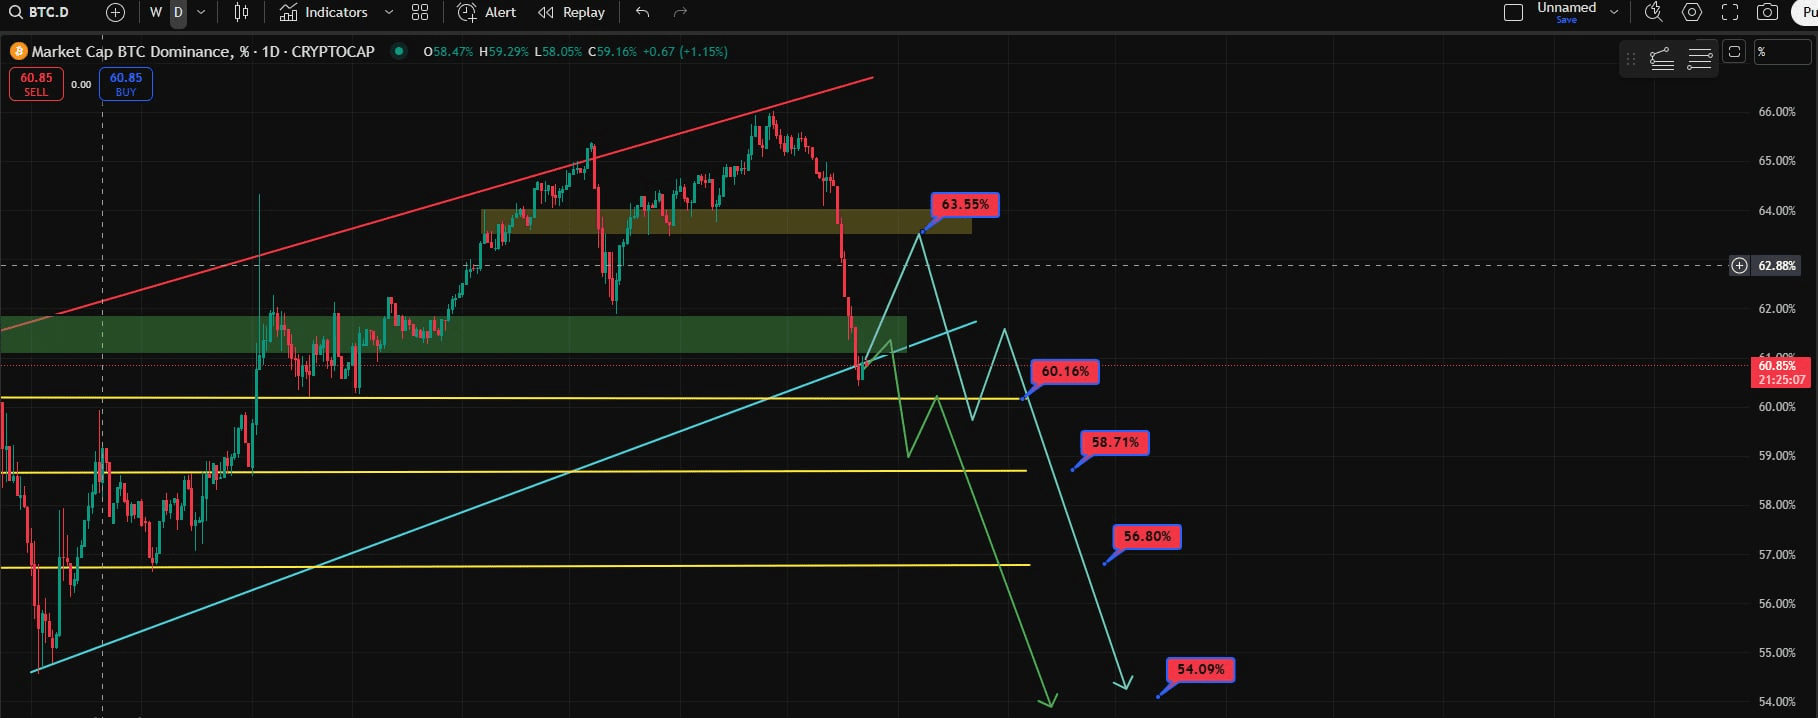
🔍 On the BTC.D chart, it can be seen that this index has broken through the main upward trendline and is retesting. Scenarios that may occur:
Scenario 1: BTC.D tests back to the 63.55% area and then drops sharply – this will clearly trigger Altseason.
Scenario 2: BTC.D will hit 62% and then drop immediately, meaning the decline will come earlier than expected.
this is a short-term view on BTC.D
🎯 Regardless of which scenario occurs, the common point is that BTC.D is in a downtrend, with target levels of 60.16%, 58.71%, 56.8%, and further down to 54.09% – these are the areas where Altcoins will have more room to operate. (this is a long-term view)
💡 Currently, only a few Altcoins are increasing significantly due to dev teams or market makers actively pushing them, which does not reflect the actual money flow trend.
Funds are shifting to some tokens with clearer trends.
3. Fear & Greed Index – Greedy but the market is still doubtful
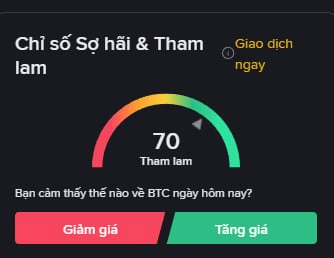
The Fear & Greed Index is currently at 70 – the greed zone. However, this is not a sign of overheating, but rather an expression of a special phase: the market is rising in doubt.
📌 Although the index showing greed is increasing, many retail investors still dare not participate, as they are still afraid after previous declines.
📉 Yesterday, I was waiting to buy the remaining 30% of my capital when BTC reached the 115k area, but unfortunately, the order did not match because the price bounced back too quickly – once again confirming that the market is being strongly accumulated, and the panic selling is an opportunity for the patient.
📌 Conclusion & Trading Strategy
✅ BTC is in a strong upward trend, confirmed by the 1D breakout and buying pressure pushing the price up even before reaching the expected support.
✅ However, funds are flowing into BTC (BTC.D is increasing) so Altcoins have temporarily not surged, only a few coins are being actively pushed. It is not advisable to buy Altcoins en masse at this time.
📍 My personal strategy
Do not rush to buy the remaining 30% volume for Altcoins – only buy more if BTC returns to 115k or if BTC.D starts to drop.
For those who haven't boarded yet, you can buy 50% of your capital at the current price range, the remaining part should wait for a good rhythm.
Those who have followed me since 05/07 are now enjoying significant profits – continue to hold, no need to rush to take profits.
🧠 Remember one thing: Q3 and Q4 will be a booming period for the Crypto market – when doubt is still too great, that’s when the market rises most sustainably.
#bnbbreakath #bnbbreakath #TrumpBitcoin #TrumpBitcoinEmpire
