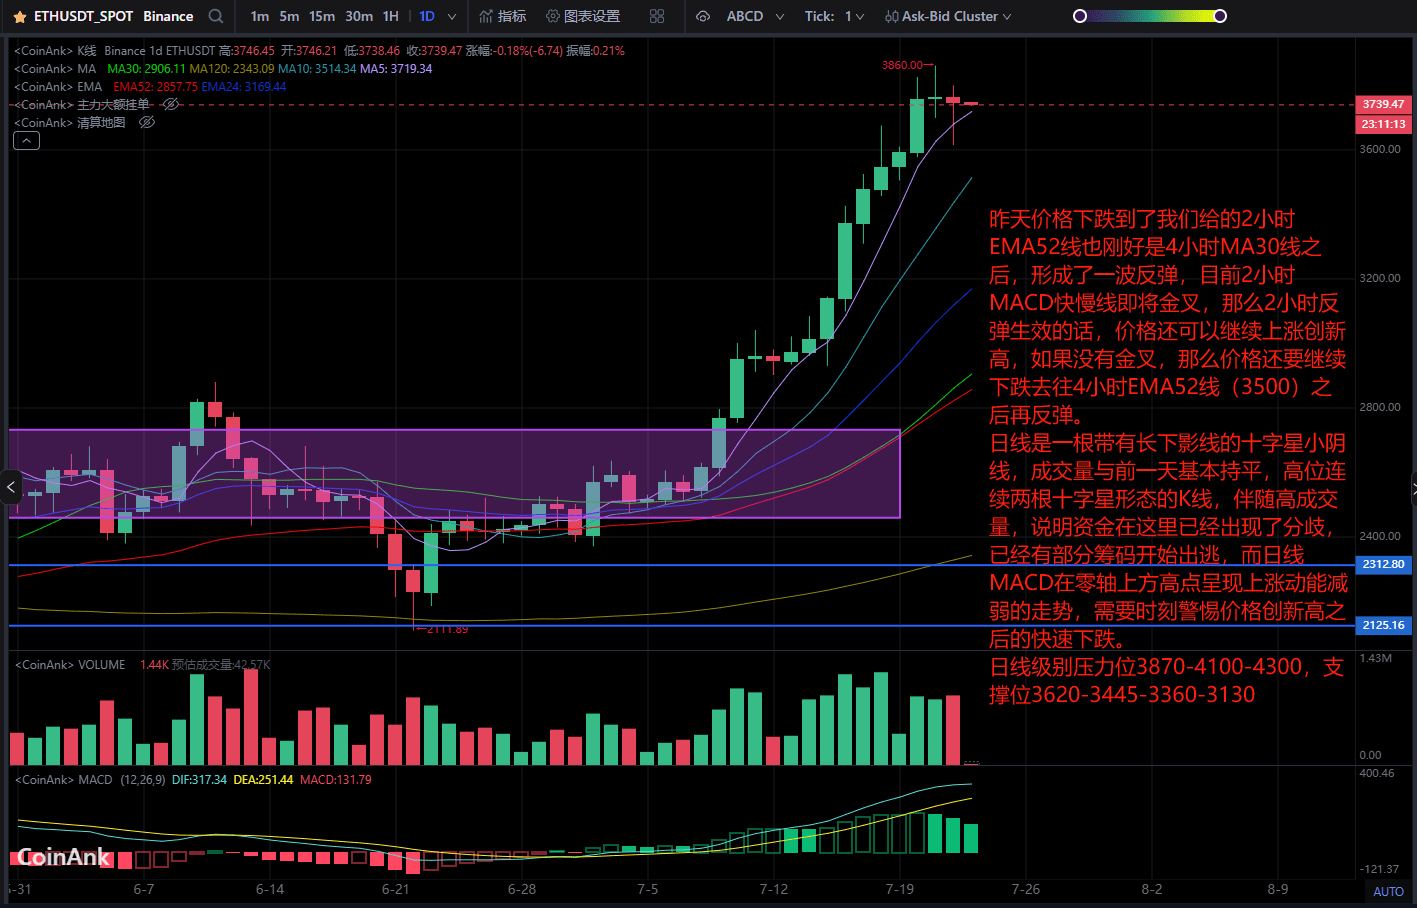
Yesterday, the price dropped to our 2-hour EMA 52 line, which coincidentally is also the 4-hour MA 30 line, forming a rebound. Currently, the 2-hour MACD fast and slow lines are about to golden cross. If the 2-hour rebound is effective, the price can continue to rise and set new highs. If there is no golden cross, the price will continue to drop towards the 4-hour EMA 52 line (3500) before rebounding again.
The daily line shows a small bearish candle with a long lower shadow, and the trading volume is basically the same as the previous day. Two consecutive doji candlestick patterns at high positions, accompanied by high trading volume, indicate that there is already a divergence of funds here, and some shares have begun to escape. The daily MACD shows a weakening upward momentum above the zero line, so we need to remain vigilant about a rapid decline after the price sets new highs.
Daily resistance levels are 3870-4100-4300, support levels are 3630-3445-3360-3130