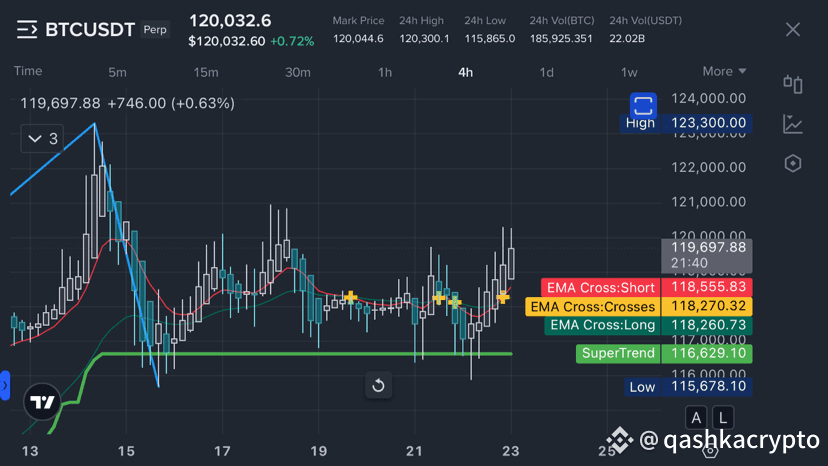
Let's break down how to use the indicators shown in your $BTC BTCUSDT Perpetual Futures chart to identify potential long and short entry points.
The chart displays several common technical indicators:
Price Candles: Show open, high, low, and close for each period.
Moving Averages (EMA Cross: Short, Crosses, Long): These likely represent a short-term, medium-term, and long-term Exponential Moving Average (EMA). The "EMA Cross: Crosses" and "EMA Cross: Long" suggest a moving average crossover strategy.
SuperTrend: A trend-following indicator.
Understanding the Strategy based on your Indicators:
The core of this strategy seems to be based on moving average crossovers for trend identification and entry, potentially confirmed by the SuperTrend indicator.
Best Strategy for Inputs to Identify Price for Long and Short Position Entry:
Given these indicators, here's a strategy focusing on defining the "best" inputs and signals:
1. Define Your EMAs (The "Inputs"):
The "EMA Cross: Short," "Crosses," and "Long" are crucial. The effectiveness of this strategy heavily depends on the periods you choose for these EMAs.
Short EMA: Sensitive to recent price changes, reacts quickly. (e.g., 9, 10, 12, 20 periods)
Medium EMA (Crosses): Often used as the "signal line" in crossovers. (e.g., 20, 26, 50 periods)
Long EMA: Less sensitive, indicates the longer-term trend. (e.g., 50, 100, 200 periods)
Recommended "Best" Input Strategy (Trial and Error is Key!):
There's no single "best" input that works for all market conditions. However, here are common and effective combinations you should experiment with:
For Swing Trading (4h/1d chart):
Short EMA: 10 or 20
Medium EMA: 50
Long EMA: 200 (for overall trend direction)
For Shorter-Term Trading (1h/4h chart):
Short EMA: 9 or 12
Medium EMA: 26
Long EMA: 50 (to quickly identify trend shifts)
How to "Correct" Your Inputs:
Backtesting: The only way to find the "best" inputs for your trading style and the current market is through extensive backtesting. Look at historical data (on different timeframes) and see which EMA combinations generated profitable signals.
Market Volatility: In highly volatile markets, shorter EMAs might give too many false signals. Longer EMAs might be better. In trending markets, shorter EMAs can capture moves quicker.
Timeframe Alignment: Ensure your EMA periods are suitable for the timeframe you are trading. A 200-period EMA on a 5-minute chart is very different from a 200-period EMA on a daily chart.
2. Strategy for Long Position Entry:
Primary Signal (EMA Crossover):
Bullish Crossover: The Short EMA crosses above the Medium EMA. This indicates a shift in short-term momentum to the upside.
Confirmation with Long EMA: Ideally, the price is above the Long EMA, and the Medium EMA is also above the Long EMA. This confirms a strong bullish long-term trend.
Confirmation with SuperTrend:
SuperTrend Green: The SuperTrend indicator turns green and is below the price, signaling an uptrend.
Additional Confirmation (Price Action):
Look for bullish candle patterns (e.g., hammer, bullish engulfing) around support levels after a pullback to an EMA.
Price making higher highs and higher lows.
Entry Strategy for Long:
Wait for the EMA Cross: The Short EMA crosses above the Medium EMA.
Check SuperTrend: SuperTrend is green.
Confirm Long-Term Trend: Price and Medium EMA are above the Long EMA.
Entry Point: Consider entering on the close of the candle that confirms the crossover, or on a slight pullback to the newly formed support (e.g., the Medium EMA).
3. Strategy for Short Position Entry:
Primary Signal (EMA Crossover):
Bearish Crossover: The Short EMA crosses below the Medium EMA. This indicates a shift in short-term momentum to the downside.
Confirmation with Long EMA: Ideally, the price is below the Long EMA, and the Medium EMA is also below the Long EMA. This confirms a strong bearish long-term trend.
Confirmation with SuperTrend:
SuperTrend Red: The SuperTrend indicator turns red and is above the price, signaling a downtrend.
Additional Confirmation (Price Action):
Look for bearish candle patterns (e.g., hanging man, bearish engulfing) around resistance levels after a bounce towards an EMA.
Price making lower lows and lower highs.
Entry Strategy for Short:
Wait for the EMA Cross: The Short EMA crosses below the Medium EMA.
Check SuperTrend: SuperTrend is red.
Confirm Long-Term Trend: Price and Medium EMA are below the Long EMA.
Entry Point: Consider entering on the close of the candle that confirms the crossover, or on a slight bounce to the newly formed resistance (e.g., the Medium EMA).
Important Considerations for "Best Strategy":
Timeframe: This is crucial. A "long" signal on a 5-minute chart might be a "short" signal on a 4-hour chart. Always align your strategy with your chosen timeframe.
Risk Management:
Stop Loss: Always place a stop-loss order to limit potential losses. For long positions, place it below a recent swing low or below a key support EMA. For short positions, place it above a recent swing high or above a key resistance EMA.
Take Profit: Define clear take-profit targets based on previous resistance/support levels, Fibonacci extensions, or a fixed risk-reward ratio (e.g., 1:2 or 1:3).
Position Sizing: Never risk more than 1-2% of your total capital on a single trade.
Market Conditions: This strategy works best in trending markets. In choppy or range-bound markets, EMA crossovers can generate many false signals. Be prepared to step aside or use other strategies in such conditions.
False Signals: No strategy is 100% accurate. You will encounter false signals. Risk management is your protection.
Divergence: Consider adding an oscillator like RSI or MACD to look for divergence, which can signal potential trend reversals, adding another layer of confirmation.
Refining Your Inputs (Trial and Error is King!):
The specific EMA periods (the "inputs") that work "best" can change over time and with different assets.
Start with common settings: (e.g., 10, 20, 50 or 20, 50, 200).
Backtest: Go through historical data on your chosen timeframe.
Optimize: Adjust the EMA periods slightly and see if the win rate and profit factor improve.
Forward Test (Paper Trading): Test your optimized strategy in live market conditions with virtual money before using real capital.
By carefully defining your EMA inputs, combining them with SuperTrend, and implementing robust risk management, you can build a more effective trading strategy.
#StrategyBTCPurchase #Write2Earn #IndicatorsThatWork $