The value of Stellar XLM has increased by over 90% in the past month, making it one of the standout altcoins in recent weeks.
While Bitcoin (BTC) and other major assets have cooled down with modest price declines and consolidation, XLM is showing new bullish signals that could pave the way for another explosive rise.
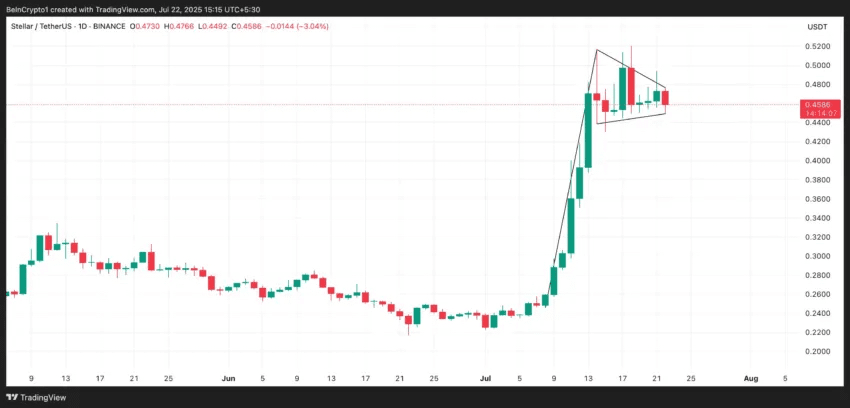
XLM forms a bullish flag: traders are betting large amounts.
On the daily chart, XLM has formed a bullish flag pattern. This pattern emerges when a strong upward price movement (flagpole) is followed by a consolidation period resembling a small symmetrical triangle (the flag).
This pattern generally indicates that buyers are temporarily pausing before continuing the upward trend. Traders often look for a breakout above the upper trendline of the flag as a signal to enter a long position.
On-chain data confirms the likelihood of XLM rising above this level in the near term. For example, the funding rate for the token remains positive, indicating demand for long positions. According to Coinglass, this rate was 0.0152% at the time of publication.
The funding rate is a periodic fee exchanged between long and short traders in perpetual futures markets.
Bullish flag for XLM.
These indicators suggest that XLM may be gearing up for a new phase of gains. If demand strengthens and XLM successfully breaks above the bullish flag pattern, traders can expect a strong upward movement.
Typically, when an asset breaks out of this pattern, its price is expected to rise by the same length as the initial price increase period - known as the "flagpole" - that preceded the formation of the flag. This suggests that the price of XLM could rise to $0.73.
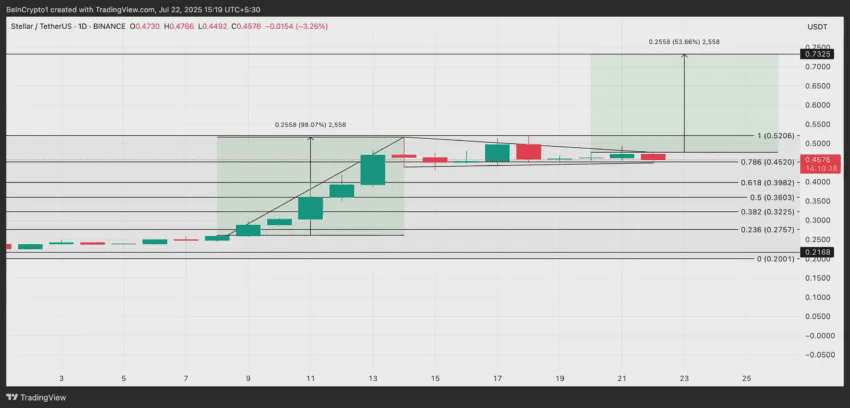
However, if market sentiment shifts from bullish to bearish, the value of XLM could drop below the flag and fall to $0.39, negating previous bullish expectations.