
Daily K-line Trend Analysis: Bitcoin's K-line closed yesterday showing a long upper shadow doji pattern, EMA14 indicates short-term support still exists. The technical aspect remains relatively healthy. Although there are signs of a bottom divergence on the daily level, liquidity has not been effectively acquired, maintaining a short-term oscillating pattern. #Strategy增持比特币
ETH Bullish Pattern Remains Intact. Ethereum is the key trading focus today, with two long positions offering excellent risk-reward ratios. It is recommended to focus on long opportunities at 3,577 and 3,628. #山寨季來了?
Solana's independent market has emerged, but the opportunity to chase long is not yet here. It is recommended to wait near 191 to enter.
Previous Review: Long at 3,718, accurately touched and rebounded to around 3,790, gaining 72 points. 3,650 bullish butterfly pattern: Successfully captured by the family channel, rebounded to 3,720, gaining 70 points. Long at 3,631: Successfully captured the rebound by combining the bullish butterfly, 4-hour EMA30, and wave high points.
BTC Resistance Level: 121,600 (Higher-Level Bullish Liquidity Area)
BTC Support Level: 114,250 (Previous Short Liquidity Acquisition Point), M Top Neckline Position (must break to confirm downtrend) $BTC
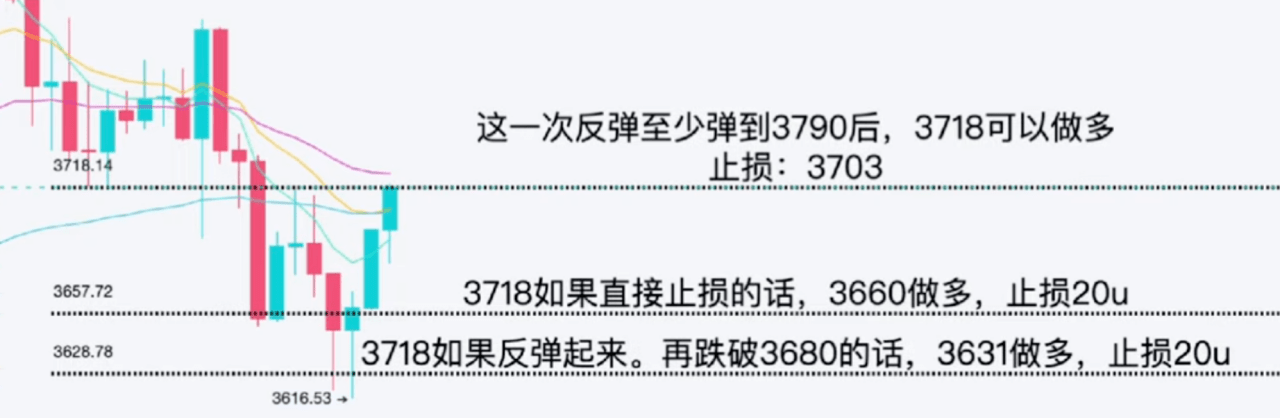
ETH Resistance Level: 3,790 (Yesterday's Rebound High Point, Short-Term Pressure), 4,000 (Psychological Barrier + Previous Target Level)
ETH Support Level: 3,577 (Fibonacci Extension 0.786 Position, Five-Wave Down Target), 3,628 (Bullish Bat Pattern 0.886 Position, Stop Loss at 3,615 with only 13 points) $ETH
SOL Support Level 1: 191 (50% Retracement + Hourly EMA60 Overlap Position)
For more detailed point analysis, please watch today's market analysis video, which contains detailed explanations. Follow Aleng to study candlesticks, and we will meet at the peak together! Follow for updates and don’t get lost, to get daily latest point interpretations!
