Hello everyone, I am your old friend Ah Yue, also a crazy promoter of Bitcoin. Mastering some candlestick techniques and reasonably using the information displayed by candlesticks can effectively help us make investment decisions.

So how should we analyze the various combinations of candlesticks? In fact, understanding candlesticks can be simplified into three steps: first, observe the bullish and bearish; second, look at the size of the bodies; third, consider the length of the shadows. Below is a summary of some candlestick patterns, hoping to provide reference for investors.
Basic Candlestick Shapes
1, Gradual Downtrend Shape:
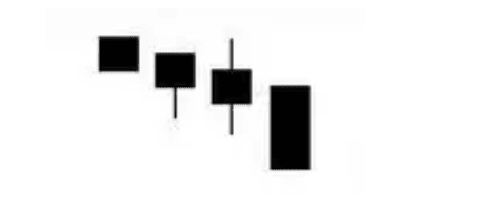
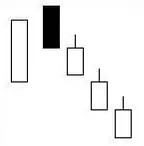
Features: (1) Mostly appears early in a downtrend; (2) Several small bearish candlesticks appear consecutively, followed by a medium or large bearish candlestick. Technical meaning: Sell signal, bearish outlook. 2, Downtrend Without End Shape:
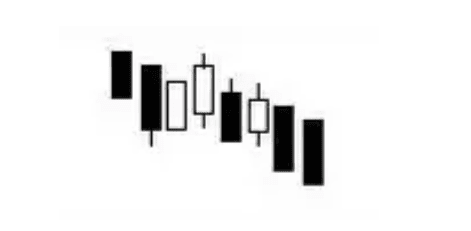
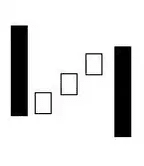
Features: (1) Appears during a downtrend; (2) Many bullish candlesticks are interspersed with relatively fewer small bullish candlesticks. The entire arrangement of candlesticks tilts downwards to the right. Technical meaning: Sell signal, bearish outlook. 3, Downward Resistance Shape:
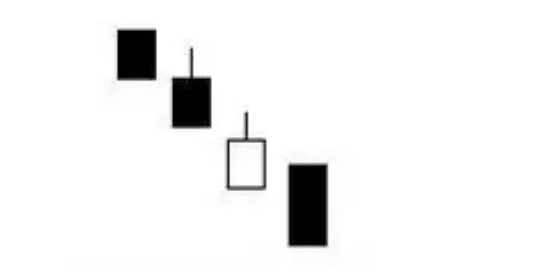
Features: (1) Appears during a downtrend; (2) Composed of several bearish and bullish candlesticks, but bearish candlesticks outnumber bullish ones; (3) Continuous gap down openings, even if a bullish candlestick appears in between, the closing price must be lower than the previous candlestick's closing price. Technical meaning: Sell signal, bearish outlook.
4, High Open Escape Shape:
Features: (1) Appears in a downtrend; (2) Suddenly opens high (even at the limit-up price), but suffers continuous pressure from bears, finally closing with a large bearish candlestick (even at the limit-down price). Technical meaning: Sell signal, bearish outlook. 5, Downward Three Stars Shape:
Features: (1) Appears early or mid in a downtrend; (2) Composed of one large and three small candlesticks; (3) During the downtrend, a large bearish or medium bearish candlestick appears first, followed by 3 small candlesticks (which can be small cross lines, small bullish, or small bearish). Technical meaning: Sell signal, bearish outlook. 6, Descending Trio Shape:
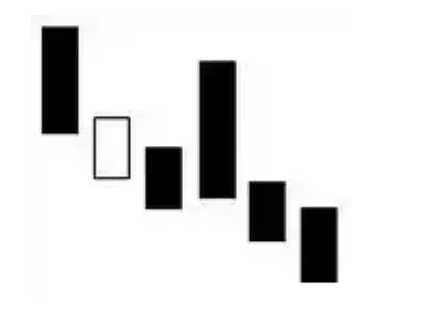
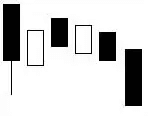
 Features: (1) Appears in a downtrend; (2) Composed of 5 candlesticks of unequal size; (3) First, a large bearish or medium bearish candlestick appears, followed by 3 small bullish candlesticks that rise upwards, yet these 3 small candlesticks do not break the opening price of the first bullish candlestick, and finally, the last large bearish or medium bearish candlestick engulfs all or most of the previous 3 small candlesticks. Technical meaning: Sell signal, bearish outlook.
7, Bearish Vanguard Shape:
Features: (1) Appears in a downtrend; (2) Composed of several candlesticks; (3) When a medium bearish or large bearish candlestick is formed, a long lower shadow is left, then the stock price rebounds, but soon the stock price falls below the lower shadow. Technical meaning: Sell signal, bearish outlook. 8, Inverted Three Bullish Candlesticks Shape:
Features: (1) Appears early in a downtrend; (2) Composed of 3 bullish candlesticks; (3) All 3 bullish candlesticks open low and close high, with the closing price lower than the opening price of the previous day. Technical meaning: Sell signal, bearish outlook. 9, Continuous Gap Up Three Bullish Candlestick Shape:
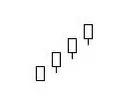
Features: (1) Appears in an uptrend; (2) Consists of 3 consecutive bullish candlesticks that gapped up. Technical meaning: Stagnation signal, bearish outlook.
10, Stalled Uptrend Shape:
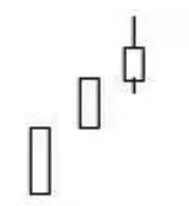
Features: (1) Appears in an uptrend; (2) Composed of 3 bullish candlesticks; (3) The bodies of the 3 bullish candlesticks become smaller, and the upper shadow of the last bullish candlestick is very long. Technical meaning: Stagnation signal, bearish outlook. 11, Stalled Uptrend Shape:
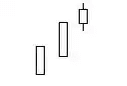
Features: (1) Appears in an uptrend; (2) Composed of 3 bullish candlesticks; (3) Initially, 2 large bullish or medium bullish candlesticks are formed, and the body of the 3rd bullish candlestick suddenly shrinks to be very small, as if the original upward momentum of the stock price is about to pause. Technical meaning: Stagnation signal, bearish outlook. 12, Bullish Candlestick with a Limp Shape:
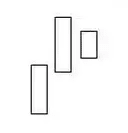
Features: (1) Appears in an uptrend; (2) Composed of 3 or more (including 3) bullish candlesticks; (3) The last 2 bullish candlesticks are all low openings, and the closing price of the last bullish candlestick is lower than that of the previous bullish candlestick. Technical meaning: Stagnation signal, bearish outlook.
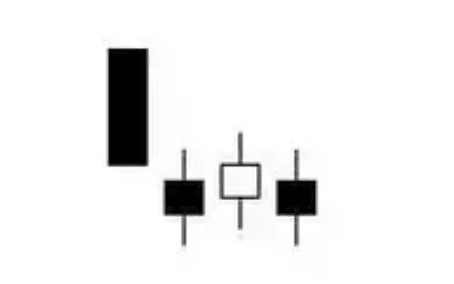
13, Two Black Crows and One Red Shape:
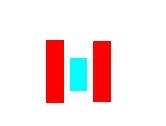
Features: (1) Can appear in both uptrends and downtrends; (2) Composed of two longer bearish candlesticks and one shorter bullish candlestick, with the bullish candlestick trapped between the bearish ones. Technical meaning: (1) Appears in an uptrend, signaling a peak; (2) Appears in a downtrend, continue to be bearish.
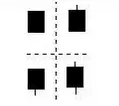
14, Large Bullish Candlestick Shape:
Features: (1) Can appear in any situation; (2) The bullish candlestick body is relatively long and may have slight upper and lower shadows. Technical meaning: (1) At the beginning of an uptrend, a large bullish candlestick appears, indicating a bullish outlook; (2) A large bullish candlestick appears during an uptrend, continue to be bullish; (3) A large bullish candlestick appears in a continuously accelerating uptrend, signaling a peak; (4) A large bullish candlestick appears during a continuous downtrend, indicating a potential bottom; (5) The longer the bullish candlestick body, the more reliable the signal. 15, Large Bearish Candlestick Shape:
Features: (1) Can appear in any situation; (2) The bearish candlestick body is relatively long and may have slight upper and lower shadows. Technical meaning: (1) A large bearish candlestick appearing in an uptrend is a peak signal; (2) A large bearish candlestick appearing at the beginning of a downtrend indicates a bearish outlook; (3) A large bearish candlestick appearing during a downtrend continues to indicate bearishness; (4) A large bearish candlestick appearing in a continuously accelerating downtrend may indicate a bearish trap.
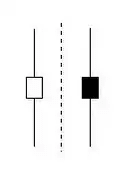
16, Small Bullish Candlestick Shape:
Features: (1) Often appears in consolidation periods, but can also appear in uptrends and downtrends; (2) The candlestick body is very small and may have slight upper and lower shadows. Technical meaning: (1) Indicates an unclear market, both bulls and bears are cautious, but bulls slightly hold the advantage; (2) The significance of a single small bullish candlestick is limited and should be analyzed in conjunction with other candlestick patterns. 17, Small Bearish Candlestick Shape:
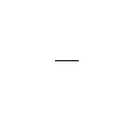
Features: (1) Often appears in consolidation periods, but can also appear in uptrends and downtrends; (2) The candlestick body is very small and may have slight upper and lower shadows. Technical meaning: (1) Indicates an unclear market, both bulls and bears are cautious, but bears slightly hold the advantage; (2) The significance of a single small bearish candlestick is limited and should be analyzed in conjunction with other candlestick patterns. 18, Cross Line Shape: Features: (1) Can appear in both uptrends and downtrends; (2) Opening price and closing price are the same, forming a "one" shape, but the upper and lower shadows are relatively short. Technical meaning: (1) Appears at the end of an uptrend, signaling a peak; (2) Appears at the end of a downtrend, signaling a bottom; (3) Appears during an uptrend, continue to be bullish; (4) Appears during a downtrend, continue to be bearish; (5) The reliability of the signal is not strong and should be analyzed in conjunction with other candlestick patterns.
19, Long Cross Line Shape:
Features: (1) Can appear in both uptrends and downtrends; (2) Opening price and closing price are the same, forming a "one" shape, but both upper and lower shadows are very long. Technical meaning: (1) Appears at the end of an uptrend, signaling a peak; (2) Appears at the end of a downtrend, signaling a bottom; (3) Appears during an uptrend, continue to be bullish; (4) Appears during a downtrend, continue to be bearish; (5) The reliability of the signal is higher than that of a typical cross line and can serve as an important reference for escaping peaks and buying bottoms. 20, Propeller Shape:
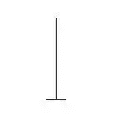
Features: (1) Can appear in both uptrends and downtrends; (2) Opening price and closing price are close, the candlestick body is very small, but the highest price and lowest price are far apart, resulting in long upper and lower shadows. Technical meaning: (1) Appears in an uptrend, signaling a bearish outlook; (2) Appears during a downtrend, continue to be bearish; (3) Appears during a continuously accelerating downtrend, indicating a potential bottom; (4) The trend reversal signal is stronger than that of a long cross line. 21, One Line Shape:
Features: (1) Can appear in both uptrends and downtrends; (2) The opening price, closing price, highest price, and lowest price are almost the same, forming a "one" shape. Technical meaning: (1) Appears in an uptrend, signaling a buy; (2) Appears in a downtrend, signaling a sell; (3) Under the limit-up and limit-down system, the one line has special significance: if a one line appears in an uptrend, it indicates that the stock price is capped at the limit-up price, suggesting strong bullish sentiment, and the stock often becomes a strong stock; if a one line appears in a downtrend, it indicates that the stock price is capped at the limit-down price, suggesting extremely strong bearish pressure, and the stock often becomes a weak stock.
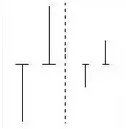
22, T Line Shape:
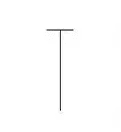
Features: (1) Opening price, closing price, and highest price are clustered together, forming a "one" shape; (2) The lowest price is quite distant from the highest price, leaving a lower shadow on the candlestick, forming a "K" shape. Technical meaning: (1) Appears at the end of an uptrend, signaling a sell; (2) Appears at the end of a downtrend, signaling a buy; (3) Appears during an uptrend, continue to be bullish; (4) Appears during a downtrend, continue to be bearish; (5) The longer the lower shadow of the T line, the greater the strength and reliability of the signal. 23, Inverted T Line Shape:
Features: (1) Opening price, closing price, and lowest price are clustered together, forming a "one" shape; (2) The highest price and the lowest price are quite distant, leaving an upper shadow on the candlestick, forming an inverted "T" shape. Technical meaning: (1) Appears at the end of an uptrend, signaling a sell; (2) Appears at the end of a downtrend, signaling a buy; (3) Appears during an uptrend, continue to be bullish; (4) Appears during a downtrend, continue to be bearish; (5) The longer the upper shadow of the inverted T line, the greater the strength and reliability of the signal; (6) An inverted T line that appears in an uptrend is called an upper inverted T line, also known as a downward reversal line. 24, Twisting Line Shape:
Features: (1) Often appears in uptrends; (2) Composed of one bullish and one bearish T candlestick. Technical meaning: (1) Appears during an uptrend, continue to be bullish; (2) Appears at the end of an uptrend, signaling a peak; (3) In an uptrend, twisting lines are mostly small T candlesticks; (4) Twisting lines appearing at the end of an uptrend are mostly large T candlesticks.
25, End Line Shape:
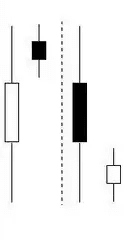
Features: (1) Can appear in both uptrends and downtrends; (2) Composed of two candlesticks, one large and one small; (3) Appears in an uptrend, the first candlestick is a large bullish or medium bullish candlestick, with an upper shadow, and the second candlestick is a small cross or small bullish/bearish candlestick, which is attached within the upper shadow of the first candlestick; (4) Appears in a downtrend, the first candlestick is a large bearish or medium bearish candlestick, with a lower shadow, and the second candlestick is a small cross or small bullish/bearish candlestick, attached within the lower shadow of the first candlestick. Technical meaning: (1) Appears in an uptrend, signaling a peak; (2) Appears in a downtrend, signaling a bottom; (3) The smaller the candlestick on the right side of the upper or lower shadow of the end line, the more reliable the signal. 26, Penetrating Head and Foot Shape:
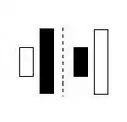
Features: (1) Can appear in both uptrends and downtrends; (2) Composed of two candlesticks of unequal size and opposite colors; (3) Appears in an uptrend, the first one is a bullish candlestick, and the second one is a bearish candlestick, the latter completely engulfs the former's body (excluding upper and lower shadows); (4) Appears in a downtrend, the first one is a bearish candlestick, and the second one is a bullish candlestick, the latter completely engulfs the former's body (excluding upper and lower shadows). Technical meaning: (1) Appears in an uptrend, signaling a sell; (2) Appears in a downtrend, signaling a buy; (3) The greater the disparity in length between the two candlesticks, or the more the longer candlestick engulfs the previous candlestick, the greater the reference value of the signal.
I am Ah Yue, focused on analysis and teaching, a mentor and friend on your investment journey! May every investor in the market sail smoothly. As an analyst, the most basic thing is to help everyone earn money. I will solve your confusion, locked positions, and provide operational advice, speaking with strength. When you are lost and don't know what to do, look to Ah Yue (homepage) to guide you.
