NAV and similar indicators are not a panacea, but rather powerful tools in a toolbox.
Undoubtedly, this round of the crypto bull market was initiated in the US stock market.
When the 'crypto reserve strategy' becomes the trend in the US stock market, and the correlation between coins and stocks emerges, how should we assess the quality of a stock? Is it based on who has a larger amount of crypto asset reserves, or who has the money to continue buying crypto assets?
If you've been frequently following analyses of crypto stocks recently, you should have seen a term repeatedly appearing --- NAV, which stands for Net Asset Value.

Some use NAV to analyze whether crypto stocks are overvalued or undervalued, while others compare the stock price of a new crypto reserve company with that of MicroStrategy; the more crucial wealth code lies in:
If a publicly listed company in the US adopts a crypto reserve strategy and holds 1 dollar worth of cryptocurrency, its value is greater than 1 dollar.
These companies with crypto asset reserves can continue to increase their holdings or buy back shares, resulting in their market value often exceeding their NAV (Net Asset Value).
However, for ordinary retail investors, most projects in the crypto circle rarely use serious indicators for evaluation, let alone use them to assess stock value in traditional capital markets.
Therefore, I also plan to do a session on the NAV indicator to help players focused on coin-stock correlation better understand the operational logic and evaluation methods of coin stocks.
NAV: How much is your stock really worth?
Before delving into crypto stocks, we need to clarify a foundational concept.
NAV is not a metric specifically designed for the crypto market, but rather one of the most common methods for measuring a company's value in traditional financial analysis. Its essential role is to answer a simple question:
How much is each share of a company really worth?
The calculation of NAV is very intuitive, which is the company's assets minus liabilities, resulting in the value shareholders can receive per share.


To better understand the core logic of NAV, we can illustrate it with a traditional example. Suppose there is a real estate company with the following financial situation:
Assets: 10 buildings, total value of 1 billion dollars; Liabilities: 200 million dollars in loans; Total shares: 100 million shares.
Thus, the company's net asset value per share is: 80 dollars per share. This means that if the company liquidates its assets and pays off all its debts, each shareholder could theoretically receive 80 dollars.
NAV is a very general financial indicator, particularly suitable for asset-driven companies, such as real estate companies and investment funds. The assets held by these companies are usually quite transparent and relatively easy to value, thus NAV can well reflect the intrinsic value of their stocks.
In traditional markets, investors typically compare NAV with the current market price of a stock to determine whether it is overvalued or undervalued:
If stock price > NAV: the stock may be at a premium, indicating that investors have confidence in the company's future growth potential;
If stock price < NAV: the stock may be undervalued, indicating that the market lacks confidence in the company, or there is uncertainty in asset valuation.
When NAV is applied to crypto stocks, its meaning undergoes some subtle changes.
In the realm of crypto stocks, the core role of NAV can be summarized as:
Measuring the impact of the crypto assets held by a publicly listed company on its stock value.
This means that NAV is no longer just the traditional formula of 'assets minus liabilities,' but must specifically consider the value of the cryptocurrency assets held by the company. The price fluctuations of these crypto assets will directly impact the company's NAV and indirectly affect its stock price.
Companies like MicroStrategy will particularly emphasize the value of their Bitcoin holdings when calculating NAV, as this portion of assets constitutes the vast majority of the company's total assets.
Thus, the above calculation method is slightly extended:


When crypto assets are included in the calculation of NAV, some changes you must consider are:
The volatility of NAV has significantly increased: due to the severe price fluctuations of cryptocurrencies, NAV is no longer as stable as real estate or fund assets in traditional markets.
The value of NAV is 'amplified' by crypto assets: crypto assets often receive premiums in the market, meaning investors are willing to pay prices above their book value to purchase related stocks. For example, a company holding 100 million dollars in Bitcoin assets may have its stock price reflect market expectations for future appreciation, leading to a market capitalization of 200 million dollars.
When the market is bullish on the future price of Bitcoin, the company's NAV may be assigned an additional premium by investors; conversely, when market sentiment is depressed, the reference value of NAV may decrease.
If you still don't understand NAV, let's use MicroStrategy as an example.


As of the time of writing (July 22), public data shows that MicroStrategy holds 607,770 Bitcoins at a price of 117,903 dollars, with a total value of around 7.2 billion dollars in Bitcoin assets and around 100 million dollars in other assets, while the company's liabilities amount to 8.2 billion dollars.
MicroStrategy's total shares are around 260 million, and based on the above calculation, its NAV is approximately 248 dollars per share. This means that under the condition of holding BTC as a crypto reserve, one share of MicroStrategy should be worth 248 dollars.
However, on the previous trading day, MicroStrategy's actual stock price was 426 dollars.
This reflects the market premium, meaning that if the market believes Bitcoin will rise in the future, investors will factor this expectation into the stock price, causing it to be higher than NAV.
This premium reflects that NAV cannot fully capture the market's optimistic expectations for crypto assets.
mNAV: The thermometer of crypto sentiment in US stocks
Beyond NAV, you will often see analysts and KOLs discussing another similar indicator --- mNAV.
If NAV is a fundamental indicator measuring how much a share is worth, then mNAV is a more advanced tool that aligns closely with the dynamics of the crypto market.
As mentioned earlier, the focus of NAV is to reflect the current net asset status of the company (mostly crypto assets), without involving market expectations for these assets; while mNAV is a more market-oriented indicator used to measure the relationship between a company’s market value and its net asset value in crypto. Its calculation formula is:


Here, 'Net Asset Value of Crypto Assets' refers to the value of the company's cryptocurrency assets minus related liabilities.
We can use a table to clearly compare the differences between the two indicators:

Similarly, based on previous calculations, MicroStrategy's total market capitalization is around 120 billion dollars, while the net value of its BTC holdings (crypto assets + other company assets - liabilities) is around 63.5 billion dollars, thus its mNAV is approximately 1.83.
In other words, MicroStrategy's market value is 1.83 times its Bitcoin asset value.
Therefore, when a company holds a large amount of cryptocurrency assets, mNAV can better reveal the market's expectations for these assets, reflecting investors' premiums or discounts on the company’s crypto assets; for example, in the case above, MicroStrategy's stock price had a premium of 1.83 times its crypto net assets.
For short-term investors focused on market sentiment, mNAV is a more sensitive reference indicator:
When the price of Bitcoin rises, investors may become more optimistic about the future performance of crypto asset-driven companies. This optimistic sentiment is reflected through mNAV, causing the market price of the company’s stock to exceed its book value (NAV).
An mNAV greater than 1 indicates that the market values the company's crypto assets at a premium; an mNAV less than 1 suggests that the market lacks confidence in the company's crypto assets.
Premium, Reflexivity Flywheel, and Death Spiral
As mentioned earlier, MicroStrategy's mNAV is currently around 1.83;
As ETH increasingly becomes an asset reserve for listed companies, understanding these companies' mNAV is also significant for identifying whether the corresponding US stocks are overvalued or undervalued.
Analyst Jadennn326eth from Cycle Trading has compiled a fairly detailed table, visually displaying the asset-liability situations and mNAV values of major ETH reserve companies (data as of last week).
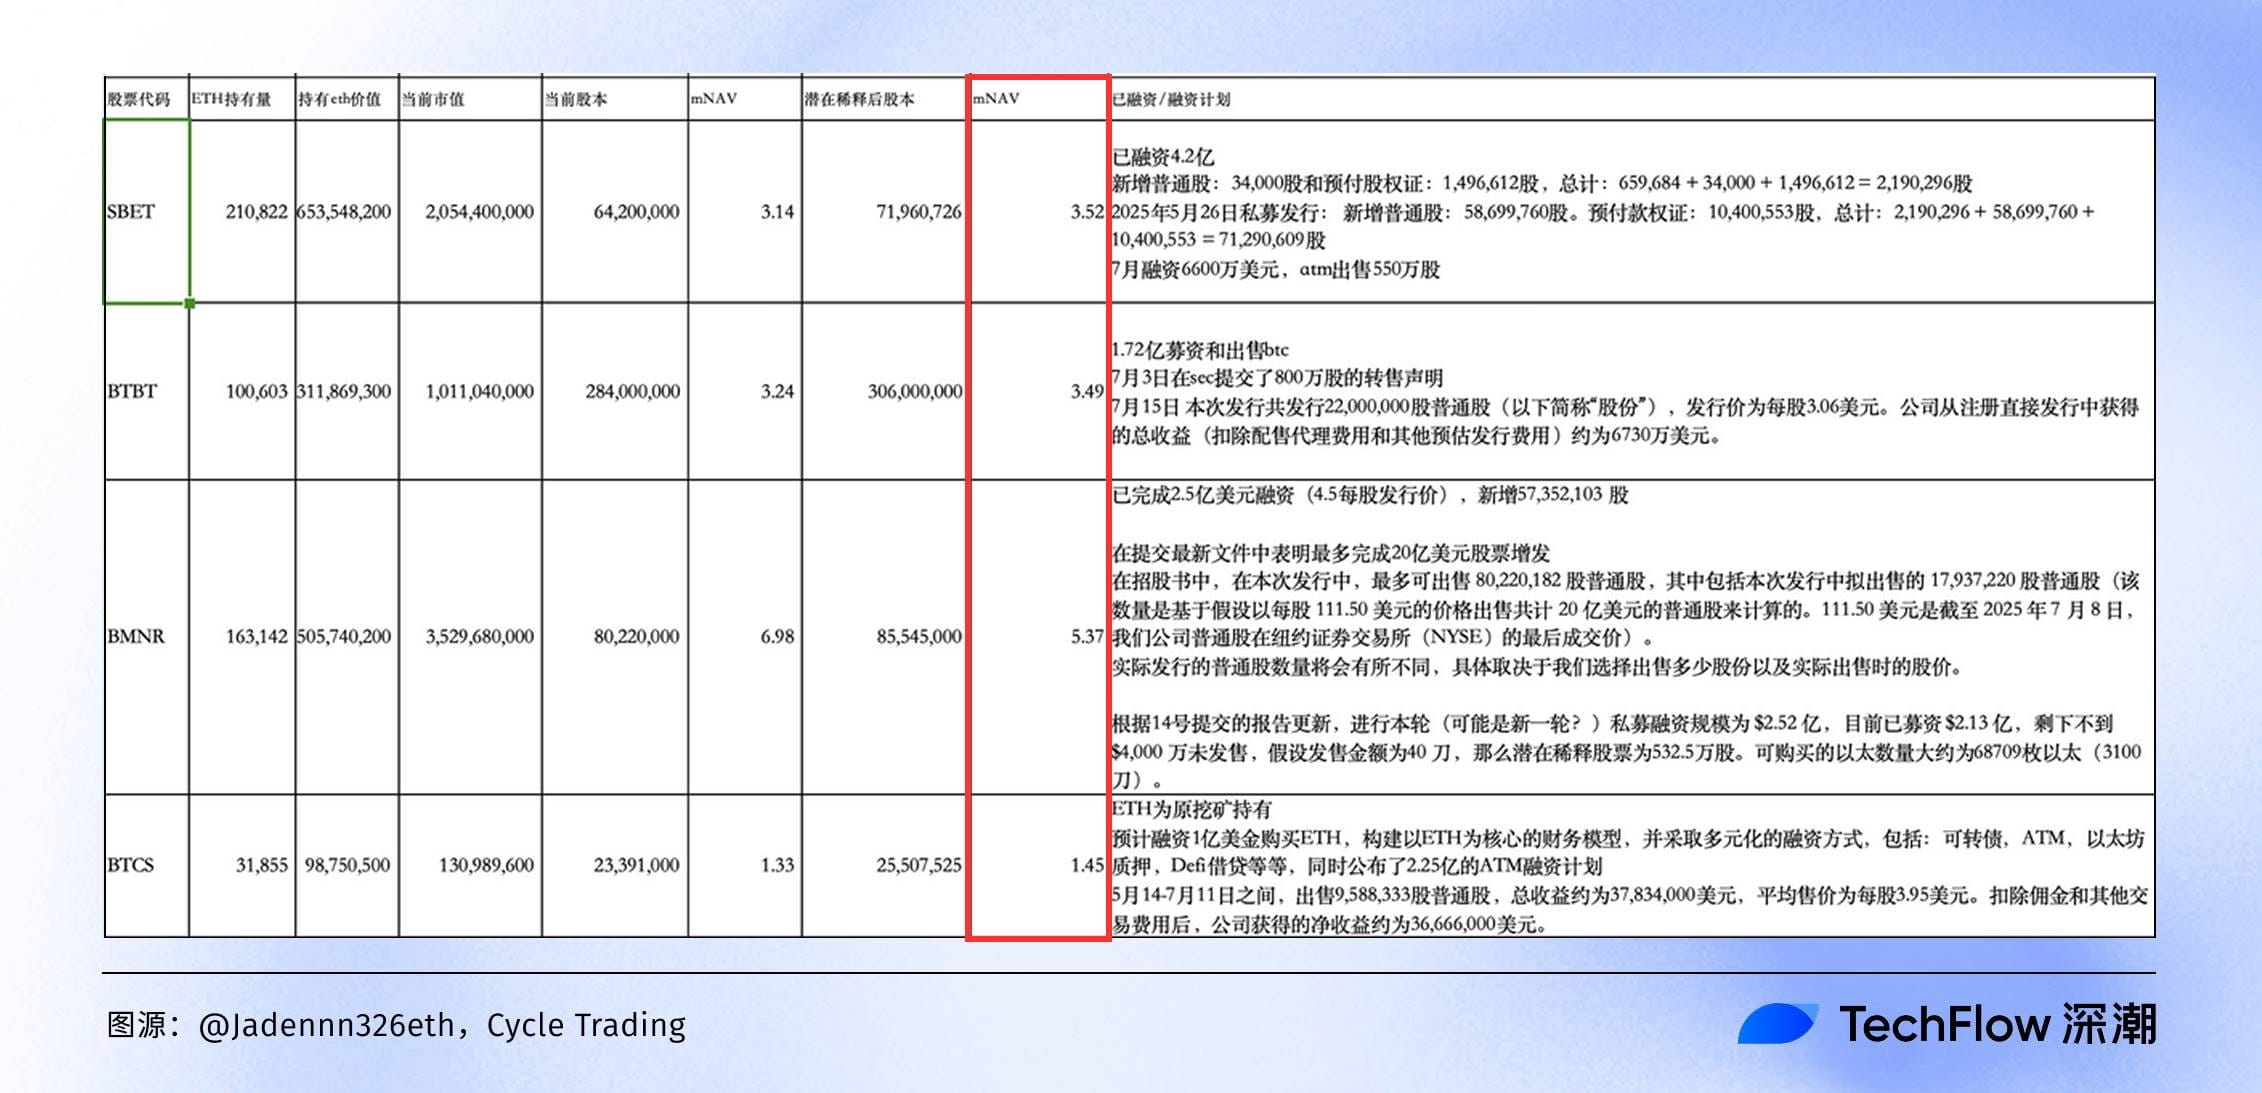
From this chart comparing the mNAV of ETH reserve companies, we can clearly see the 'wealth map' of coin-stock correlation in 2025:
BMNR ranks first with an mNAV of 6.98, with a market cap far exceeding its ETH holdings, but this may hide an overvaluation bubble - once ETH retraces, the stock price will be the first to suffer damage. In contrast, BTCS has only an mNAV of 1.53, which is relatively low in premium.
Since we've seen the data from these companies, we must discuss the 'Reflexivity Flywheel.'
This concept originates from financial mogul Soros's reflexivity theory, which has become the 'secret engine' behind the explosive rise of these companies' stock prices in the coin-stock correlation bull market of 2025.
Simply put, the Reflexivity Flywheel is a positive feedback loop: the company first issues stock or conducts ATM (At-The-Market) financing, acquiring cash to buy ETH in bulk; the increase in ETH holdings boosts NAV and mNAV, attracting more investors to buy, leading to soaring stock prices; a higher market capitalization makes it easier for the company to refinance and continue increasing ETH holdings... thus forming a self-reinforcing, snowball-like flywheel effect.

However, if the ETH price retraces, regulation tightens (such as SEC scrutiny of crypto reserve models), or financing costs soar, the upward flywheel may reverse into a death spiral: stock price collapse, mNAV plummeting, and in the end, the ones getting hurt may also be the retail investors.
Finally, by this point, you should understand:
NAV and similar indicators are not a panacea, but rather powerful tools in a toolbox.
When players chase coin-stock correlation, they should rationally assess by combining the macro trends of Bitcoin/Ethereum, companies' debt levels, and growth rates, in order to find their own opportunities in what seems like a landscape of opportunities but is actually a perilous new cycle.
$BNB $XRP $BTC
#Strategy增持比特币 #GENIUS稳定币法案 #NFT板块领涨


