In this market, if you do not understand the meanings of these formations, your account will often not look good, especially the last two formations, which often appear before the main force starts to rally. If you still cannot distinguish bottom formations or judge the behavior of the main force, you must watch this content until the end. In fact, each candlestick represents a contest between bulls and bears, not just a price. There are some experts in the market who do not look at any indicators, only at candlesticks, and manage to support their families through stock trading. It is evident that candlesticks are very important.
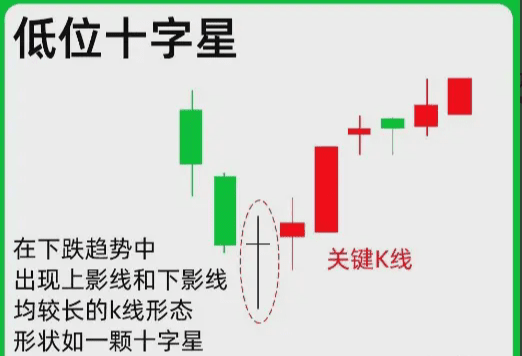
One. A low-position Doji appears after a significant price drop. The main observation is the situation on the next day after the Doji, whether the price breaks through the high point of the Doji.
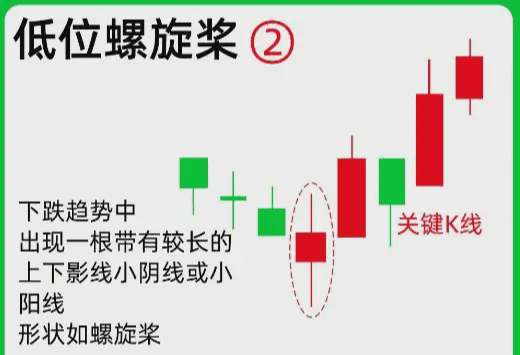
Two. The low-position Spinning Top should appear at the end of a downtrend, which can be either a bullish or bearish candle, with longer upper and lower shadows. It is necessary to observe whether the trend continues or reverses the next day.
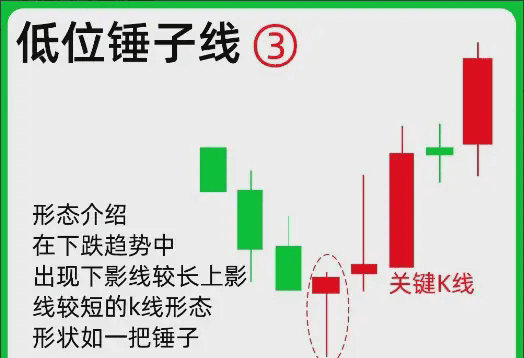
Three. A low-position Hammer with a long lower shadow and a short upper shadow appears in a downtrend. We look at Chart Three.
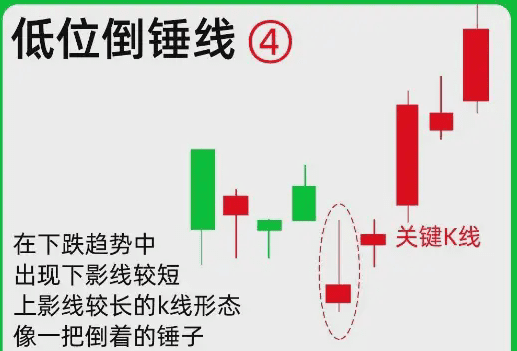
Four. The low-position Inverted Hammer has a short lower shadow, a long upper shadow, and a small body. If the price is above the body the next day, it indicates that the bullish force is relatively strong.
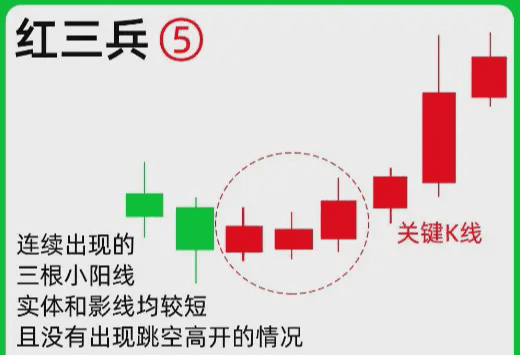
Five. The Red Three Soldiers consist of three consecutive small bullish candles with short shadows. If the market can break through the highest price of the third candle in the Red Three Soldiers, it indicates that the main force is very strong at this time.
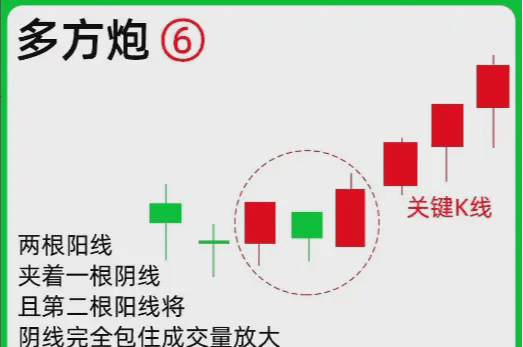
Six. The Bullish Cannon consists of two bullish candles surrounding one bearish candle, with the last candlestick engulfing the middle bearish candle, forming a Bullish Cannon. Often at this time, the trading volume will also increase.
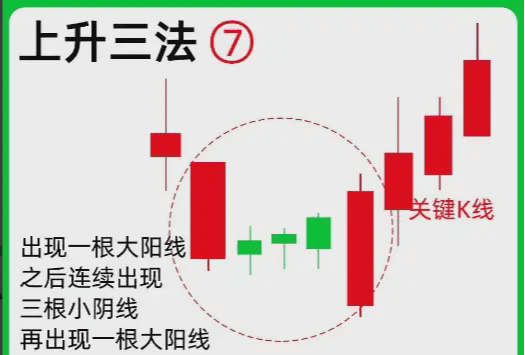
Seven. The Rising Three Methods appear in the bottom area, with a large bullish candle followed by three consecutive small bearish candles, and then another large bullish candle. We look at Chart Seven.
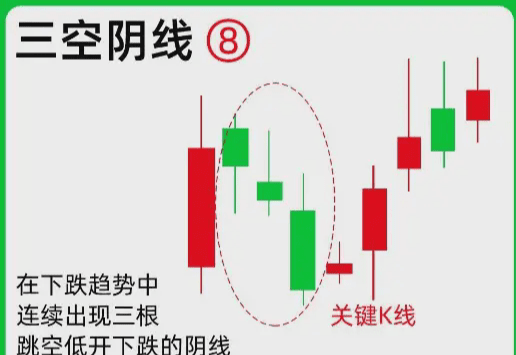
Eight. In a downtrend with three consecutive bearish candles, if there are three consecutive gap-down bearish candles and the market does not create new lows, staying above the opening price of the third candle indicates that selling pressure is starting to weaken. The above is eight key bottom candles worth noting. The article should be combined with the following case studies to deepen memory.
Follow Liang Ge for the most valuable operational insights. #币安HODLer空投ERA $BTC


