Market Overview: Bitcoin has been on a tear in mid-2025. After breaking past its 2022 lows, BTC decisively climbed above six-figure levels. In June 2025 it reached roughly $110,000 (its first time into six figures) before pulling back to about $99,000 on a brief dip, then rebounding to close the month near $107,000 – the highest monthly close to date. In July, bullish momentum resumed: BTC spiked to a new all-time high around $122,838 on July 14. As of late July, BTC trades in the $118,000–$121,000 range. This uptrend has been driven by strong momentum and heavy buying: BTC is well above its key moving averages (see below) and has firm technical support. The recent rally has also been accompanied by record market caps (crypto market cap just topped $4 trillion) and elevated overall volume, indicating widespread interest.
Intraday Highs/Lows & Volume: Volatility has been high as prices climb. For example, on July 3 BTC/USDT ranged from a low of about $107,272 to a high of $109,610. By mid-July (July 18), intraday swings were roughly $117,785 to $120,689, with BTC ending that day near $120,352. Trading volumes have spiked accordingly: one report noted a 56.5% jump in 24h Bitcoin volume to roughly $109.9 billion in mid-July. Such large volume – across both spot and futures markets – underscores active participation by traders. Institutional inflows have been a big part of this: U.S. spot Bitcoin ETFs saw about $4 billion in net inflows during June, and firms like Fidelity, BlackRock, and others continue to buy into strength. Meanwhile, Bitcoin’s market cap and dominance (now ~65%) have surged as capital has rotated into BTC and out of altcoins.
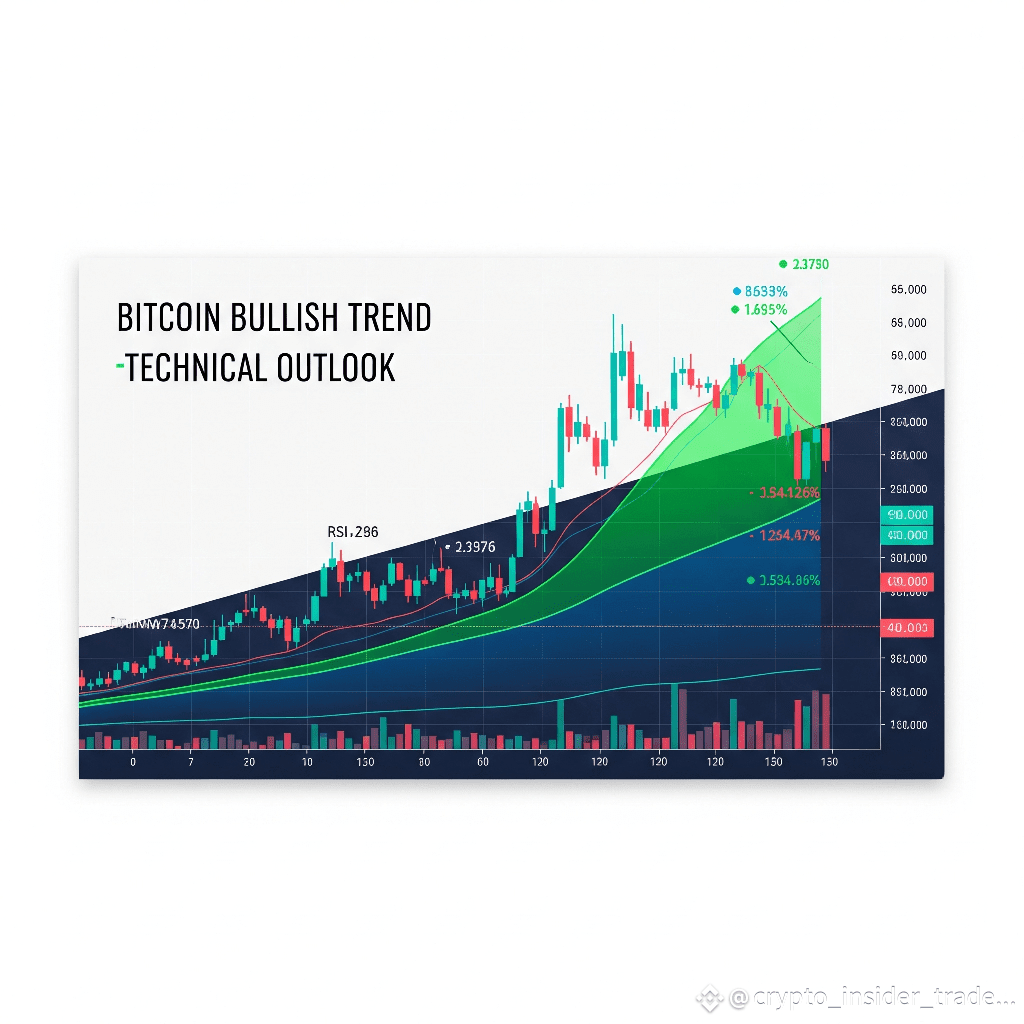
Technical Indicators and Chart:
Bitcoin daily price chart with 20/50/100/200-day EMAs and MACD. Technically, BTC is firmly bullish. The chart above shows BTC trading around $121k (as of mid-July) with all major moving averages well below current price. The 20-day EMA is near ~$112k and the 50-day EMA around $103.3k and ~$96.9k) are even further below, confirming a steep uptrend. The Relative Strength Index (14-day) is about 63, indicating bullish momentum without being extremely overbought. The MACD line is well above its signal line (roughly MACD=3397 vs Signal=2099), reflecting strong upward momentum. In summary, BTC’s indicators point to sustained strength. Key levels to watch: support near $112k (20d EMA) and ~$108k (50d EMA), and resistance at the recently-broken $118k–$120k zone. Next resistance targets lie around $123k–$130k. As long as price holds above major moving averages, the technical bias remains positive.
Key Technical Metrics (July 2025):
1. RSI(14) ≈ 63 (moderately bullish).
2. MACD (12,26,9) – bullish (MACD ≈ 3397, Signal ≈ 2099).
3. MA(20): ~$112,065; MA(50): ~$107,900; MA(100): ~$103,322; MA(200): ~$96,920 (price is well above all).
4. Support Levels: ≈$112,000 / $107,900 / $103,300 (20/50/100-day EMAs).
5. Resistance Levels: ≈$123,000 / $126,000 / $130,000 (Fibonacci targets, upper chart bands).
Institutional & Retail Interest: Strong capital flows underpin the rally. Institutional demand is at an all-time high: June’s ETF inflows alone topped $4 billion, and large institutions keep buying on dips. BlackRock’s Bitcoin Trust (IBIT) manages ~$75 billion in BTC, and corporate treasuries like MicroStrategy hold roughly 597,000 BTC. Recent news (e.g. a 30,000 BTC SPAC purchase in July) has reinforced this institutional appetite. Retail sentiment is positive but cautious. Surveys show roughly equal numbers of bullish vs. bearish traders, reflecting a healthy mix of FOMO and profit-taking. The crypto “Fear & Greed” index is in the 66–68 range (greed zone) – optimistic but not extreme. Even as Bitcoin surges, many traders remain mindful of potential pullbacks. Overall, both retail and institutional interest are solidly pro-BTC at present, providing robust demand for perpetual contracts.
Funding Rates & Market Sentiment:
Chart: Bitcoin price (black line) vs. Crypto Fear & Greed Index (green). Current F&G ≈66% (greed); note that past cycle tops occurred near extreme ≈75–80% (dashed line). This suggests optimism without euphoric excess. Funding rates on perpetual futures offer further clues. Currently funding is near neutral: Binance notes that funding above 0.01% indicates bullish sentiment, while below 0.005% signals bearishness. Mid-June saw funding dip into negative territory – the lowest in seven weeks – even as BTC rallied to ~$108k. This unusual negative funding amidst rising prices suggested leveraged longs were not overheated. Today, funding rates sit modestly positive, reflecting a balanced market view. Sentiment indices, as shown above, remain elevated but not overheated. The Fear & Greed Index (~66–68) is in the upper band but still well below the 75–80% peaks seen at prior tops. In short, perp market dynamics indicate an optimistic mood that has not yet become extreme.
Short-Term and Medium-Term Outlook: In the near term (days–weeks), BTC’s trend is still up. Technical analyses project continued gains: for example, one mid-July forecast predicted BTC reaching the mid-$125k range by late July. Some models see targets as high as ~$130k–$140k by month-end, backed by strong demand. The key will be maintaining support above critical levels: if BTC stays above roughly $120k, it could push to those new highs. Conversely, traders warn that failure to break new resistance could trigger a pullback. Analysts note that a drop back below ~$114k might lead to a short-term correction to around $110k–$112k, and in a worst case (e.g. macro shock) even retest $100k. Therefore, for now the bias is bullish so long as BTC holds support; a sustained close above $121k would strengthen the rally.
Over the medium term (3–6 months), the majority view remains bullish. Many institutions and analysts maintain high year-end targets. Forecasts range from $130k–$150k by late 2025, to even $200k or more in extreme scenarios, fueled by factors like halving supply cuts and continued ETF inflows. In particular, the long-term “log growth curve” models suggest BTC is still in a bull market build-up. That said, the sharp rally warns of possible consolidation: we note that some call for profit-taking after the run-up. Key longer-term supports to watch are ~$102k–$105k (below which deeper corrections could unfold). If the market avoids a severe pullback, however, the path appears set for new highs later in 2025.
Conclusion: Bitcoin perpetual markets are currently characterized by robust bullish momentum, high volume, and strong institutional demand. Technical indicators (RSI, MACD, moving averages) all favor further upside, and sentiment remains hopeful but not frothy. In the short term BTC is likely to probe mid-$120k levels, testing new resistance at ~$125k–$130k. Over the medium term, continued inflows and supply fundamentals support multi-year highs (analysts broadly project $130k+ by Q4). Traders should keep an eye on key support levels (around $102k–$110k) for any signs of weakness, but for now the outlook for BTC perpetual contracts is decidedly bullish, backed by both technical signals and fundamental flows.