What does a mature trading system look like?
All trading systems consist of four frameworks:
Judging the trend direction
Choosing entry conditions and entry positions
Setting stop-loss and profit targets after opening a position
Application of Capital Management.
Two more points to note about trading systems:
First: The trading system can be composed of familiar indicators, but once composed, it cannot be applied directly in real combat. After the system is formed, it must enter the backtesting phase, validating its profitability through extensive backtesting, before gradually applying it in practice.
Second: The trading system should not be too complex; it should be easy to execute. The principle to grasp: the simpler, the better to execute, provided it can be profitable.
MACD Buy the Dip and Capture the Bull, seize the golden opportunity for swing trading! Easily identify market highs and lows
One, MACD is the most commonly used indicator by experts
The MACD indicator holds a special and indispensable position in technical analysis. Its importance lies in:
Historically verified effectiveness: It is one of the most effective and widely used indicators verified by historical trends.
Trend grasping tool: Derived from the EMA indicator, it is effective for capturing trending markets and is an essential reference for trend investors.
Top and bottom divergence is widely recognized: its top and bottom divergence is recognized as the best method for "buying the dip and selling the peak" and is an important practical tool in trend theory and wave theory.
The return to verification value: Many traders start by learning MACD, abandon it midway, but after a long time of learning comparison and practical testing, they ultimately return to MACD, which shows its unique value.
Widely used in quantitative applications: It is extremely widely used in quantitative trading.
It is precisely because of these advantages that MACD has become the most commonly used technical indicator among professional traders.
Two, The Concept and Algorithm of the MACD Indicator
The MACD indicator, or the Exponential Moving Average Convergence Divergence, created by Gerald Appel, is used to track trends and assess buying and selling opportunities. This indicator is commonly used in trading software and is known as the 'king of indicators' (see [Figure 1]).
The MACD indicator in the cryptocurrency circle consists of the DIF fast line, DEA slow line, MACD column line, and zero axis, these 'three lines and one axis.' Traders analyze the crossovers, divergences, breakthroughs, supports, and resistances of these 'three lines and one axis' to assess price.
Three, MACD Golden Cross and Death Cross
A golden cross refers to a short-term line crossing above a long-term line (of the same type), often indicating a short-term buying opportunity. If it occurs in the following positions, it is more reliable:
① After a sharp decline during a downtrend; ② After a pullback during an uptrend; ③ After consolidation during an uptrend (i.e., a phase low).
Death cross refers to a short-term line crossing below a long-term line (of the same type), often indicating a short-term selling opportunity. If it occurs in the following positions, it is more reliable:
① After consolidation during a downtrend; ② After a rebound during an uptrend; ③ After a sharp rise during an uptrend (i.e., a phase high).
The golden cross and death cross of MACD occur in different positions, which have different meanings:
Situation One: Buy point for low-position golden cross
Occurs below the zero axis and far from the zero axis. Usually considered only a short-term rebound signal; whether it is truly a reversal needs to be confirmed by other indicators.
Case Study: On August 27, 2019, BTC 10-minute candlestick, after a price pullback, a low-position golden cross appeared, followed by a rebound of about $200, suitable for short-term entry.
Situation Two: Buy point for golden cross near the zero axis
After an uptrend is formed, it occurs near the zero axis. Often an excellent buying opportunity, signaling the end of adjustment and the start of a new upward trend. If accompanied by a golden cross of the volume line (support from volume), the signal is more reliable.
Case Study: On August 19, 2019, at 09:30, BTC 5-minute candlestick, breaking the 30-day moving average initially formed an upward trend. At 14:00, a golden cross appeared near the MACD zero axis, indicating a significant rise; one could buy decisively.
Situation Three: Buy point for high-position golden cross
Occurs in a far region above the zero axis. Often appears after consolidation during an uptrend, indicating the end of consolidation and a continuation of the previous upward trend, which is a good signal for increasing positions. When it appears after a prolonged slow rise, it often indicates an accelerated rise.
Case Study: On June 25, 2019, BTC 3-hour candlestick, after consolidating during an upward trend, rose again, with MACD golden cross at a high position. This indicates that the pullback has ended; one can seize the opportunity to increase positions.
Situation Four: Sell point for low-position death cross
Occurs far below the zero axis. Often appears at the end of a pullback in a downtrend, serving as a sell signal at the end of the pullback. Those who have not entered should observe, and those who are deeply trapped may sell first to wait for a drop to lower costs.
Case Study: On July 14, 2019, LTC 3-hour candlestick, a low-position golden cross triggered a small rebound, followed by a MACD low-position death cross, starting a new round of decline. Spot investors can sell at the death cross and then buy back.
Situation Five: Sell point near the zero axis death cross
In a downtrend, the DIFF line crosses below the DEA line near the zero axis. This indicates that the market is accumulating downward momentum near the zero axis, and the death cross predicts momentum release, continuing the downtrend.
Case Study: On August 12, 2019, BTC 1-hour candlestick, the DIFF line crosses below the DEA line near the zero axis. This indicates the release of downward momentum, a sell signal, and one should sell decisively.
Situation Six: Sell point for high-position death cross
The DIFF line crosses below the DEA line far above the zero axis. Sometimes accompanied by a MACD top divergence (new high in price, DIFF/DEA lines do not create new highs or decline). A death cross is formed when the DIF line crosses below the DEA line at the zero axis, which is a relatively reliable sell signal.
Case Study: On August 23, 2019, TRX 1-hour candlestick, a new high in price but the DIF/DEA did not rise, later forming a death cross, indicating a sell signal.
Four, Divergence Between MACD and Candlesticks
Divergence refers to price movements that are opposite to indicator trends; it is a highly successful and widely used analysis method.
Bottom divergence: In a downtrend, a new low in price, but indicators do not reach new lows (such as the DIFF line or MACD column line), indicating accumulation of upward momentum, a buy signal.
Top Divergence: In an uptrend, a new high in price, but indicators do not create new highs (such as the DIFF line or MACD column line), indicating accumulation of downward momentum, a sell signal.
I. Bottom Divergence
(1) Bottom divergence between MACD column lines and DIFF lines
DIFF Bottom Divergence: In a downtrend, a new low in price, but the DIFF line does not reach a new low, indicating that the DIFF decline is smaller than the price decline, accumulating upward momentum.
Column line bottom divergence: In a downtrend, a new low in price, but the MACD column line does not reach a new low, indicating accumulation of upward momentum.
(2) Specific buying timing (must be combined with other tools)
Signal One: Column line color change or MACD golden cross: After a bottom divergence, the column line changes from green to red (shortens before changing color) or a golden cross occurs, indicating that upward momentum dominates, making it a relatively reliable buy signal.
Case Study: On August 26, 2019, ETH 15-minute candlestick, price reached a new low but the column line did not reach a new low (bottom divergence), followed by the column line changing from green to red, forming an overlapping buy signal.
Signal Two: Combined with other tools/candlestick reversal patterns: such as bottom divergence + 'single needle probing bottom,' 'three soldiers at the bottom,' etc., the reliability greatly increases.
Case Study: On August 26, 2016, BTC 30-minute candlestick, a new low in price but the column line did not reach a new low (bottom divergence), accompanied by a 'single needle probing bottom' pattern, formed a buy signal before rising.
II. Top Divergence
(1) Top divergence between MACD column lines and DIFF lines
Column line top divergence: In an uptrend, a new high in price, but the MACD column line does not reach a new high, indicating accumulation of downward momentum.
DIFF Top Divergence: In an uptrend, a new high in price, but the DIFF line does not reach a new high, indicating accumulation of downward momentum.
(2) Specific selling timing (must be combined with other tools)
Signal One: Column line color change or MACD death cross: After a top divergence, the column line changes from red to green (shortens before changing color) or a death cross occurs, indicating the release of downward momentum or dominance.
Case Study: On August 9, 2019, HT 1-hour candlestick, a new high in price but the column line did not reach a new high (top divergence), followed by the column line changing from red to green, forming an overlapping sell signal.
Signal Two: Combined with other tools/candlestick reversal patterns: such as top divergence + 'Evening Star' and other bearish patterns.
Case Study: On July 20, 2019, ETH 3-hour candlestick, a new high in price but the column line did not reach a new high (top divergence), the column line shortened, and at the same time, the candlestick formed an 'Evening Star,' allowing for timely exit to avoid a downturn.
Appendix: Evening Star: In an uptrend, a long bullish candle appears first, followed by a short candlestick (either bullish or bearish, referred to as a 'star') the next day, and on the third day, a long bearish candle penetrates deeply into the body of the first day's bullish candle. This is a signal of a top reversal.
(There will be a dedicated course in the future to explain the top/bottom candlestick patterns in depth, please stay tuned)
Five, Modifications to MACD Parameters
The default MACD parameters (12/26/9) sometimes react slowly to price changes, leading to suboptimal buy and sell prices. Adjusting parameters can make it more sensitive. Commonly used parameter combinations include: 5/34/5, 5/10/30, etc. Investors can try out various combinations.
[MACD Buy the Dip and Capture the Bull] Key points analysis (daily chart reference):
Yellow column below the zero axis (bearish strength): When the green column head above the yellow column disappears, followed by a red arrow and a money bag icon, it is a signal to build positions (consider buying).
Red column head above the zero axis (bullish strength): Indicates that bullish strength is increasing, and the trend is strengthening; consider increasing positions.
Blue column above the zero axis (bullish strength): When the red column head above the blue column disappears, and a green arrow appears, it is a signal to escape the peak (consider selling).
Trading Mindset:
Looking back at the first three years of trading cryptocurrencies, my assets once shrank by 80%, filled with bitterness and challenges. After deep reflection, I distilled six iron rules and committed to practicing them, ultimately turning defeat into victory. Now I share this experience with fellow traders in the cryptocurrency world to assist you on your journey!
In the vast sea of cryptocurrency, true winners excel through profound market insights and ironclad discipline. Master and strictly adhere to the following six major rules to help you navigate smoothly:
(Please retain the position and importance of the six major rules you emphasized here)
Trading cryptocurrencies is not only a battle of skills and luck but also a test of mentality and wisdom. Only by mastering these iron rules and strictly adhering to them can you stand undefeated in the cryptocurrency world!
These are the lessons learned from real trading experiences! Behind each one is suffering; sharing them is to help you avoid detours; please take them seriously!
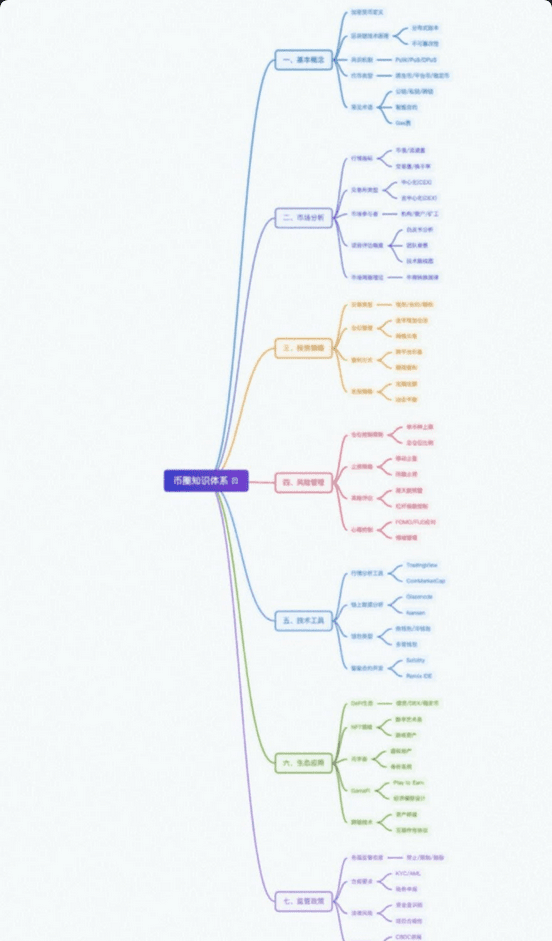
Knowledge System Overview (General Outline of Cryptocurrency Trading System):
Below, I will share a knowledge framework covering the cryptocurrency trading system to assist you in systematic learning:
1. Basic Concepts of Cryptocurrency
Two. Market Analysis of Cryptocurrency
Three. Investment Strategies in Cryptocurrency
Four. Risk Management in Cryptocurrency
Five. Technical Tools in Cryptocurrency
Six. Ecological Applications in Cryptocurrency
Seven. Regulatory Policies in Cryptocurrency
Trading Philosophy:
Trading is both atmospheric and meticulous. Pursuing absolute highs and lows is excessive. It’s okay to be vague and precise, as long as you take precautions. The pattern lies in putting aside the meaningless.
When you win, keep quiet; when you lose, keep quiet. Showing off profits is the beginning of failure. Happiness and pain are next to each other; do not disturb. This mindset easily shifts your focus to gains and losses rather than the system. The focus is not on how much you win or lose, but on how much you grow.
Great virtue (trading system) carries things, nourishing things silently, wealth comes naturally. Life is also speculation; one must always be in awe and often reflect on one's mistakes.
Investment is not an industry rewarded by hard work; it is even the opposite.
Remember: any operation can go wrong at any time. But speculation is an absolute personal heroism venture. One must stick to oneself while also being able to give up oneself and proactively admit mistakes. How to grasp the balance in between?
The road is difficult; it is not in the mountains, not in the water, but in the repeated fluctuations of the market.
Profit is finding a glimmer of possibility amidst impossibility, facing life and death with composure. Speculation is life; it is only about giving and taking. Knowing when to stop will lead to gains.