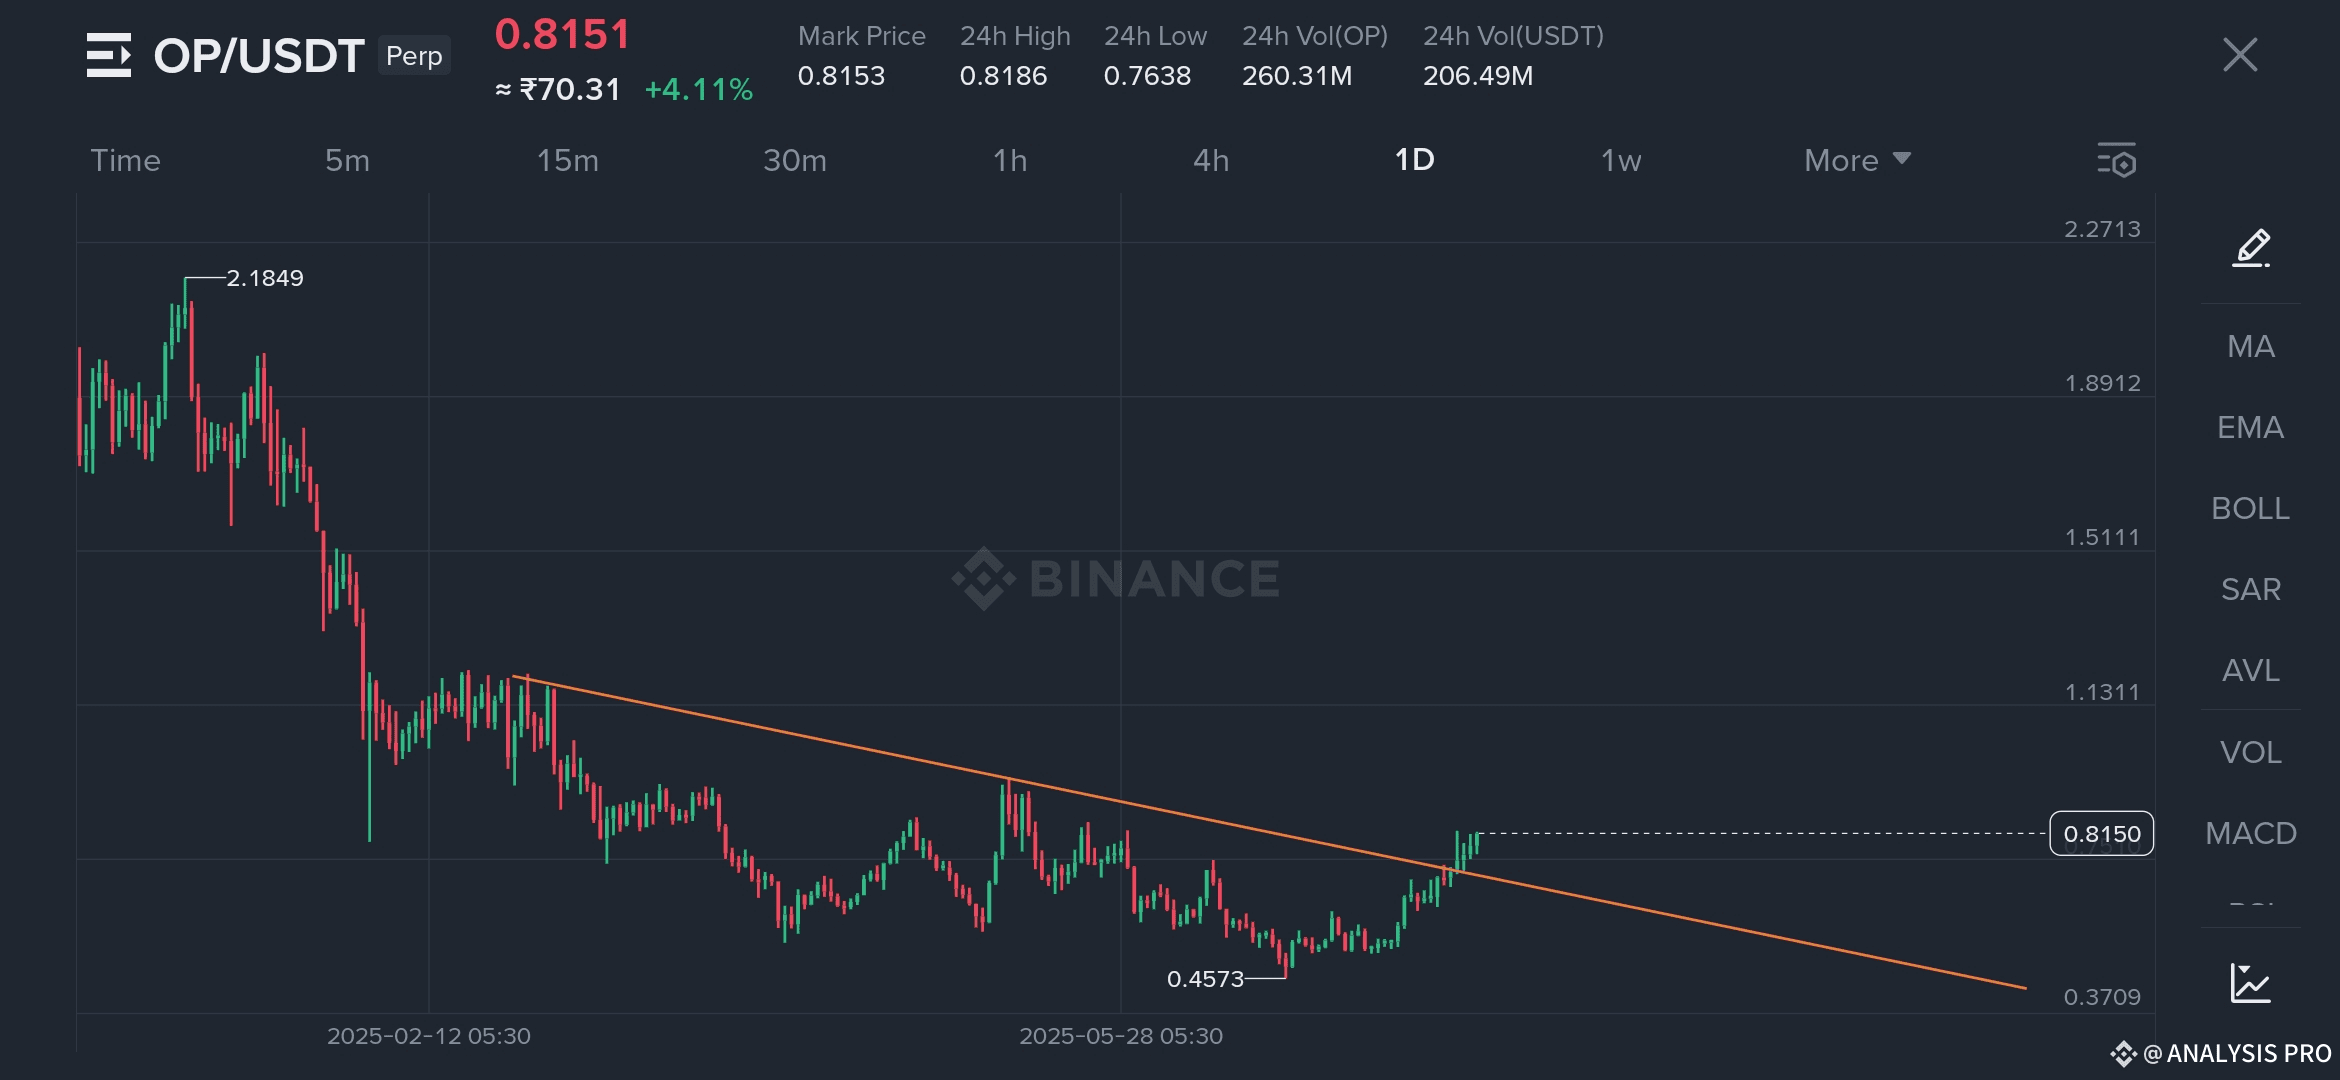
The daily chart of Optimism (OP/USDT) on Binance shows a significant technical development — a bullish breakout from a long-standing descending trendline. This breakout could mark the end of a multi-month downtrend and the beginning of a potential uptrend.
🔍 Key Technical Observations:
Descending Trendline Broken:
The OP price had been in a strong downtrend since reaching its high of $2.18.
Price action was repeatedly rejected from a descending trendline, but as of July 21, 2025, the breakout has occurred.
Current price: $0.8151, showing a +4.11% daily gain.
Support and Resistance Levels:
Recent low: $0.4573 (May 28, 2025) — this formed the base of accumulation.
Breakout zone: Around $0.80, which now turns into a support zone.
Next resistance targets: $1.13, $1.51, and potentially $1.89 if momentum continues.
Volume Surge:
24h volume has spiked to 260M OP, showing growing interest and confirmation of the breakout.
Psychological Shift:
Breaking the trendline after several months of consolidation indicates bulls are regaining control.
This move may attract fresh investors and traders expecting a trend reversal.
📈 What’s Next for OP?
If the breakout sustains above the $0.80 level with continued volume, OP could start a recovery cycle aiming toward $1.13 and beyond. However, a daily close below the breakout trendline could invalidate this move and bring a retest of lower supports.
🧠 Investor Sentiment
With Ethereum Layer 2 solutions gaining attention, OP’s fundamental backing as the native token of Optimism — combined with this bullish breakout — makes it one to watch closely in the coming weeks.
Conclusion:
The breakout from the descending trendline on the OP/USDT daily chart signals a potential trend reversal. With increasing volume and positive price action, Optimism may be poised for a bullish run—pending confirmation of support above $0.80.