
BTC/USD 30M Technical Analysis
🔍 Chart Summary:
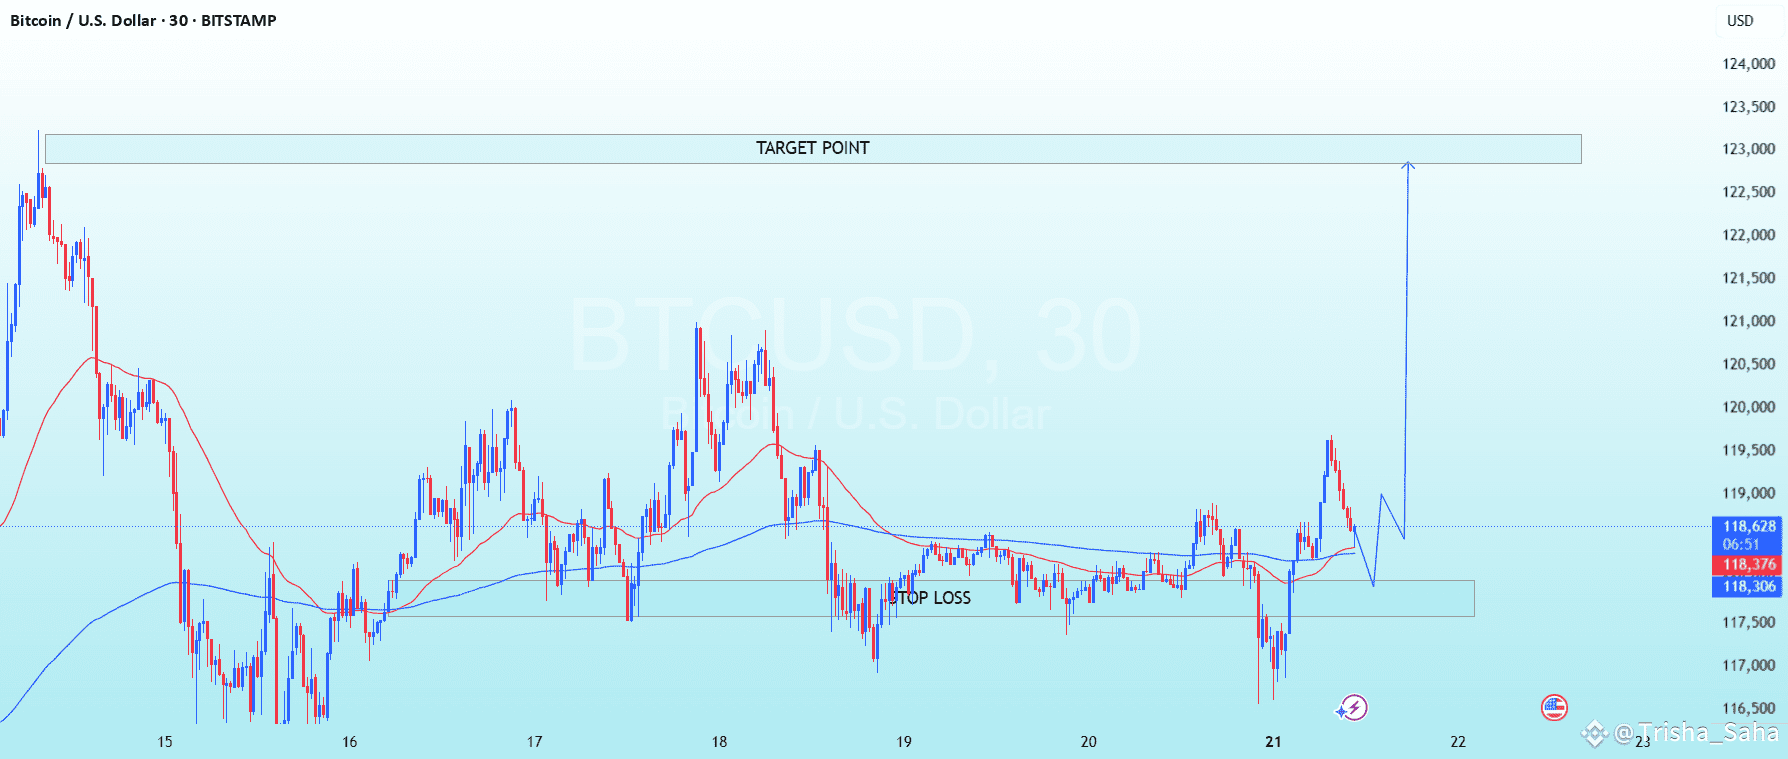
The chart shows Bitcoin attempting a recovery after a period of consolidation near a support zone.
A clear target point is marked near the 123,000 USD level, suggesting a bullish breakout projection.
The price action shows a higher low formation, hinting at strengthening bullish momentum.
📏 Key Technical Levels:
Support Zone: ~117,500 – 118,000 USD. This is the highlighted area where buyers may defend the trend.
Resistance/Target: ~123,000 USD. This is the projected upside target based on the pattern.
Stop Loss: Placed below the support zone to manage downside risk.
📊 Moving Averages:
The chart displays two MAs:
Short-term MA (red line): Currently crossing above the long-term MA, signaling bullish momentum.
Long-term MA (blue line): Acting as dynamic support/resistance. Price is trying to hold above it.
🔮 Potential Scenario:
If BTC holds above the support zone and the moving averages align, the price could rally toward the target zone near 123,000 USD.
A break below the support and stop loss area could invalidate the bullish setup.
✅ Strategy:
Traders might look for confirmation near the support zone for long entries.
Tight risk management is essential, with stop loss just below the marked support.
#BTCvsETH #ETHBreaks3700 #StablecoinLaw #NFTMarketWatch #StrategyBTCPurchase