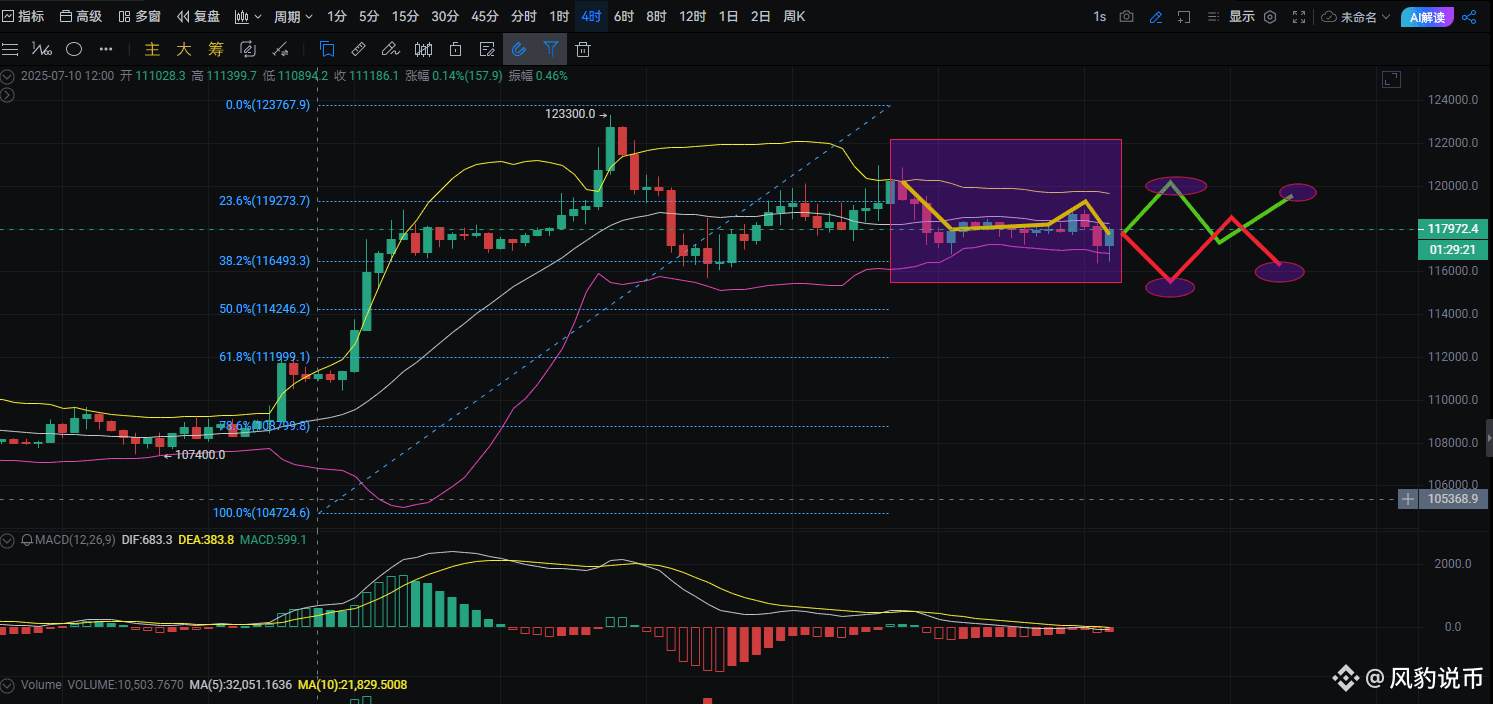
At 4 AM, BTC closed with a bearish candlestick around $116,699, with trading volume significantly increasing compared to the previous 4 hours. The bears are demonstrating through action: during the consolidation phase, every surge is a test of the market. But don’t panic; the technical indicators hold hidden secrets. The MACD histogram is green but hasn't made a new low, and the KDJ has formed a dead cross with the K value stuck at 76, the "bull-bear dividing line," which is reminiscent of the power-up signal before ETH broke through $2,000 in September 2023.
Three major variables in the news:
Institutions "secretly store their goods": CoinShares data shows that recent net inflows into BTC funds have exceeded $1 billion, with over 60% coming from traditional hedge funds. These "large funds" specifically target the consolidation market. Policy "combination punches" are being implemented: the UK's FCA stablecoin new regulations + the advancement of the US GENIUS Act is equivalent to giving BTC a "compliance engine" that may challenge the position of gold reserves in the long term. The Federal Reserve is the "key player": before the July 31 interest rate decision, the market has bet on "keeping interest rates unchanged," but if Powell releases a "dovish" signal, BTC may break through the $120,000 mark.
Three core technical signals:
Moving averages interweave to form a "pre-reversal signal": prices are stuck in the dense area of MA20-MA200 between $116,929 and $119,741. This "narrow fluctuation of a thousand points" often indicates a directional choice. Historical data shows that before BTC broke through $60,000 in October 2021, it fluctuated in a similar range for 12 days. The volume-price relationship now shows a "deceleration signal": during yesterday's decline, selling pressure increased, but compared to the significant drop on July 18, the current selling pressure intensity has weakened by about 30%, suggesting a decline in bearish power, and smart money may have already adjusted positions. The indicator group "hides breakthrough opportunities": the MACD histogram remains negative, but the DIF line is flattening, and the Bollinger Bands have narrowed to the $115,000-$122,000 range. This formation historically has over a 70% probability of triggering a unilateral market, with the key being supporting trading volume.
Personal opinion: The current market is very similar to the situation before BTC broke through in May 2021, with institutions quietly building positions, policy expectations heating up, and technical indicators showing a desire to rise after a dip. Those who are shouting bearish sentiments while focusing on the "Tesla selling BTC" news may have forgotten the classic case where after Musk supported Dogecoin in May 2021, BTC instead skyrocketed by over 35%.
If you are unsure about the actual price levels for effective breakouts, you can follow me.
Still, the same saying: the market never lacks opportunities, what it lacks is the vision to see through the tactics. Follow me, top team support, only serving ambitious lunatics.