

We're heading into a relatively quiet week, but a subtle warning sign is forming on the 1D chart that deserves our attention 👀
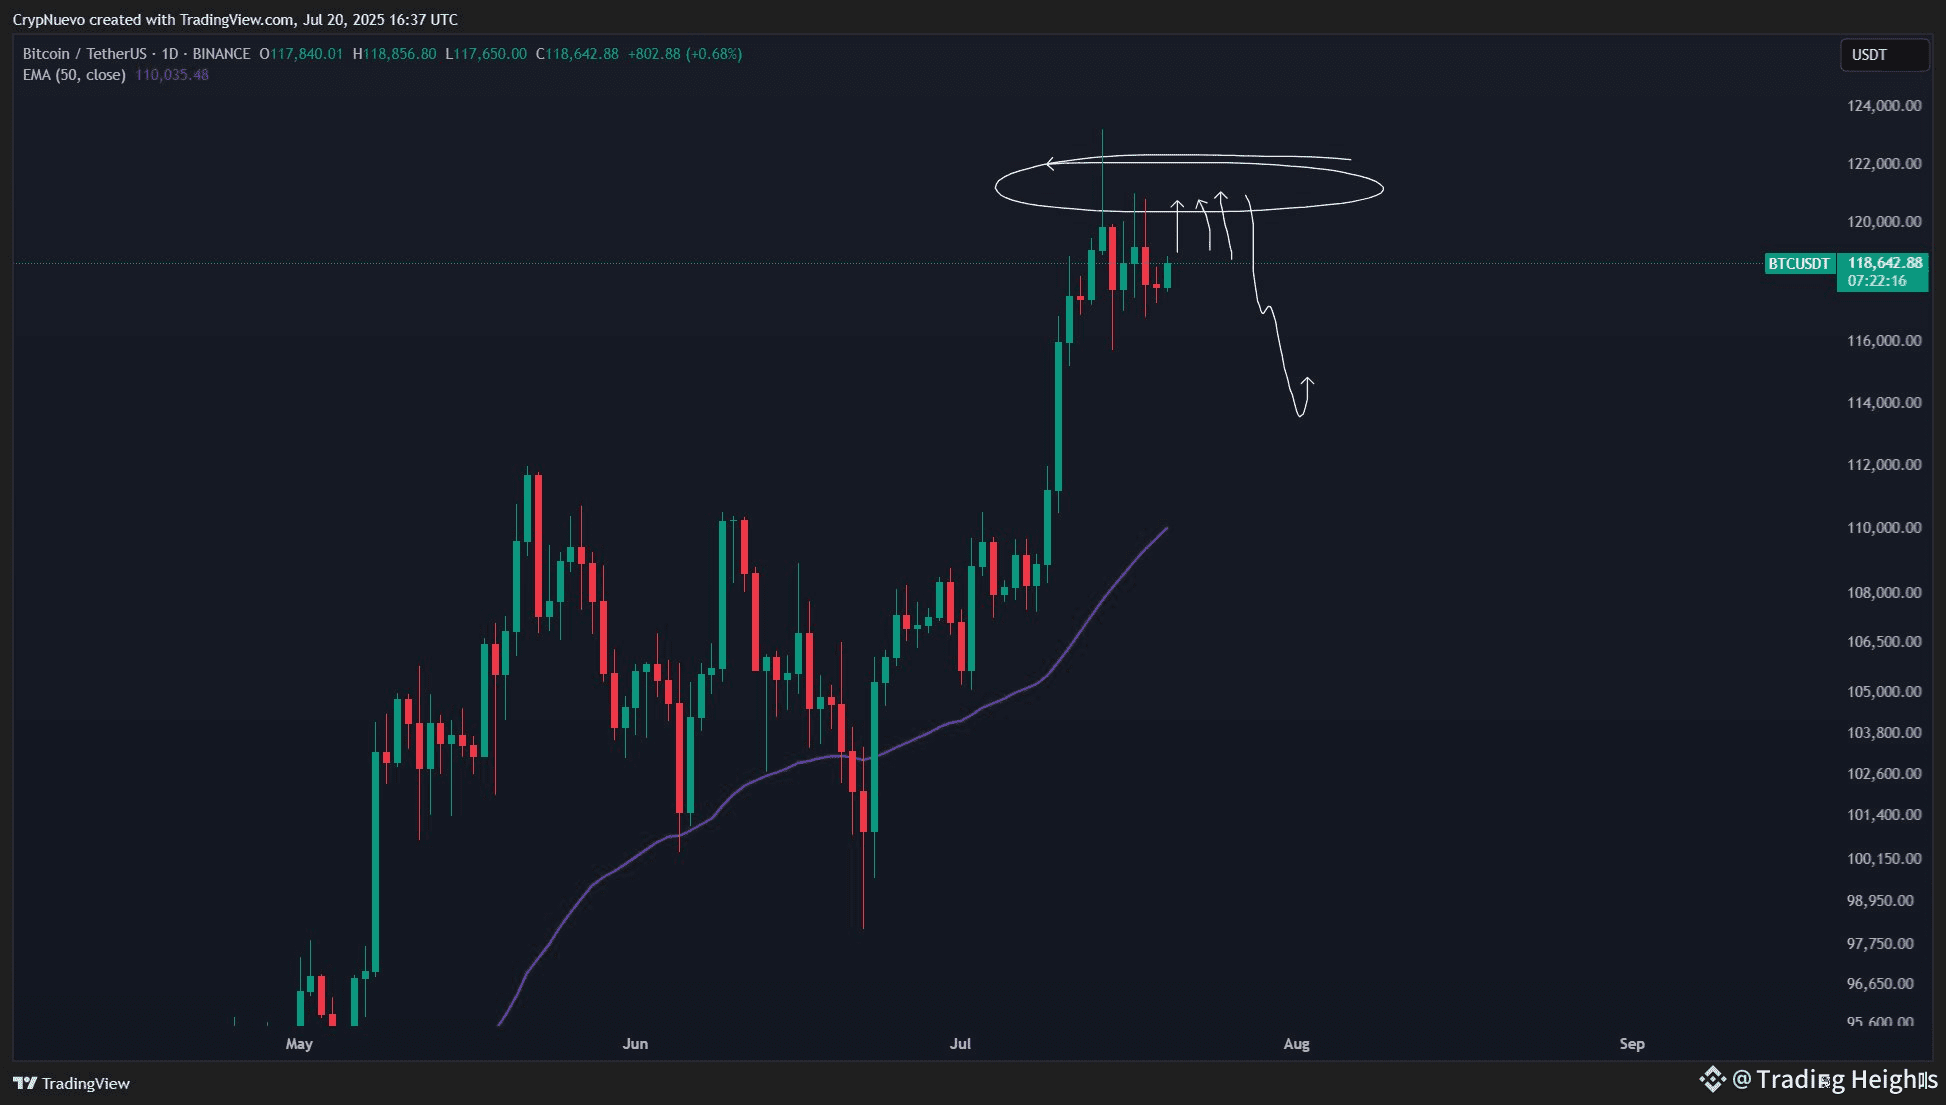
⚠️ Possible Reversal Signal Forming
🔹 Wicks to the upside with no real price progression
🔹 Market Makers might be building short positions
🔹 We've seen a similar pattern back in January
🔹 Need 2–3 more daily candles to validate this signal
🔹 Just a caution flag, not panic — pullbacks are normal in uptrends
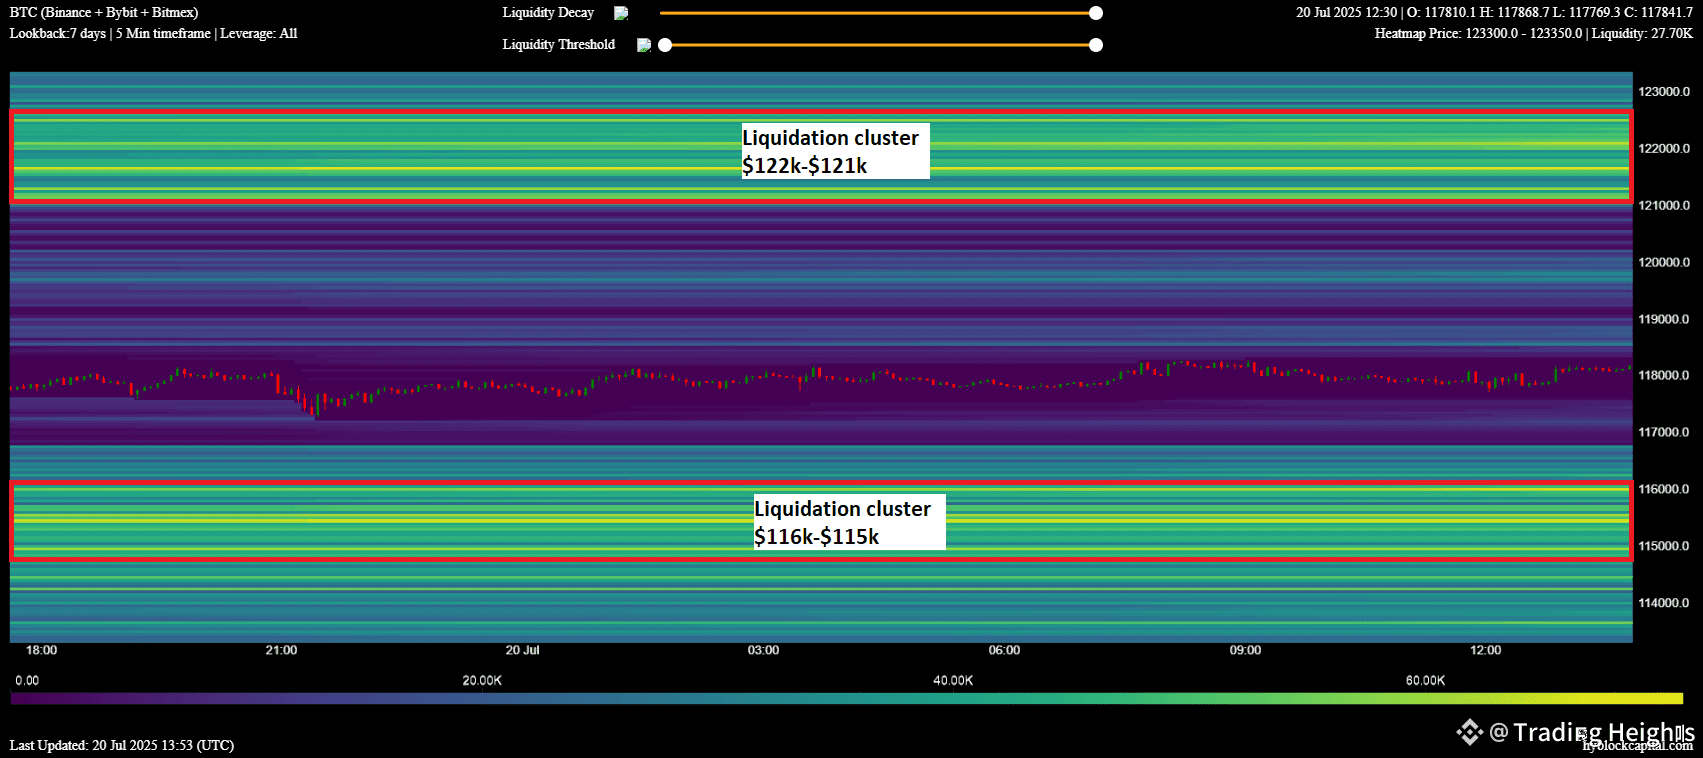
🔥 Liquidation Heatmap Zones
We're floating between two liquidation clusters
🔹 $122k - $121k ➡️ Could be triggered by a fakeout wick
🔹 $116k - $115k ➡️ More likely during a deeper pullback
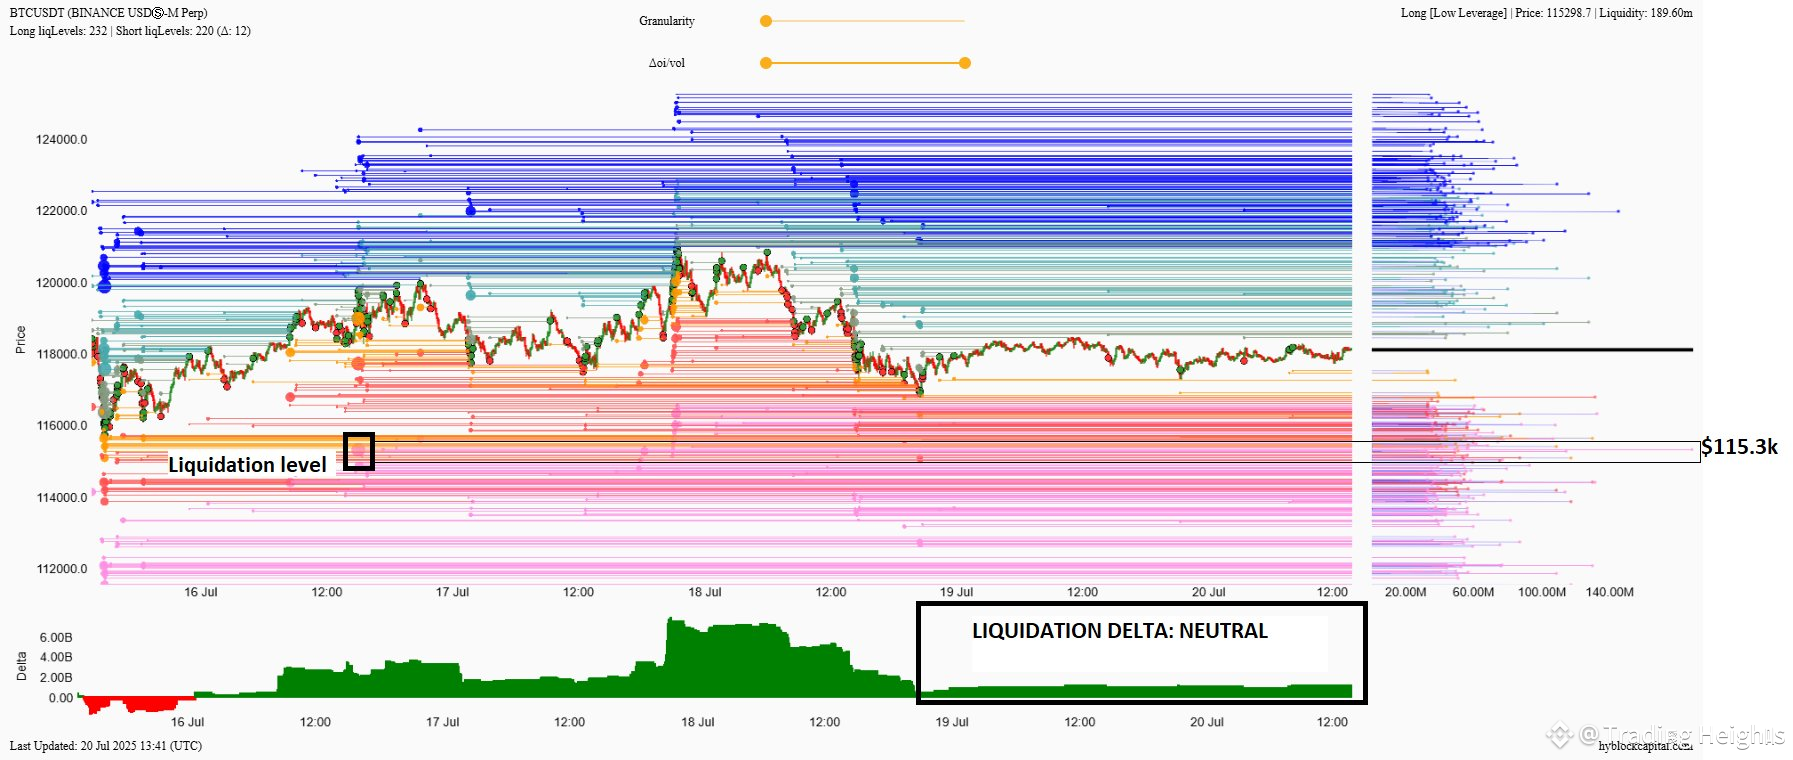
👀 Key observation: The largest single liquidation level is at $115.3k
🕳️ CME Gap Lurking Below
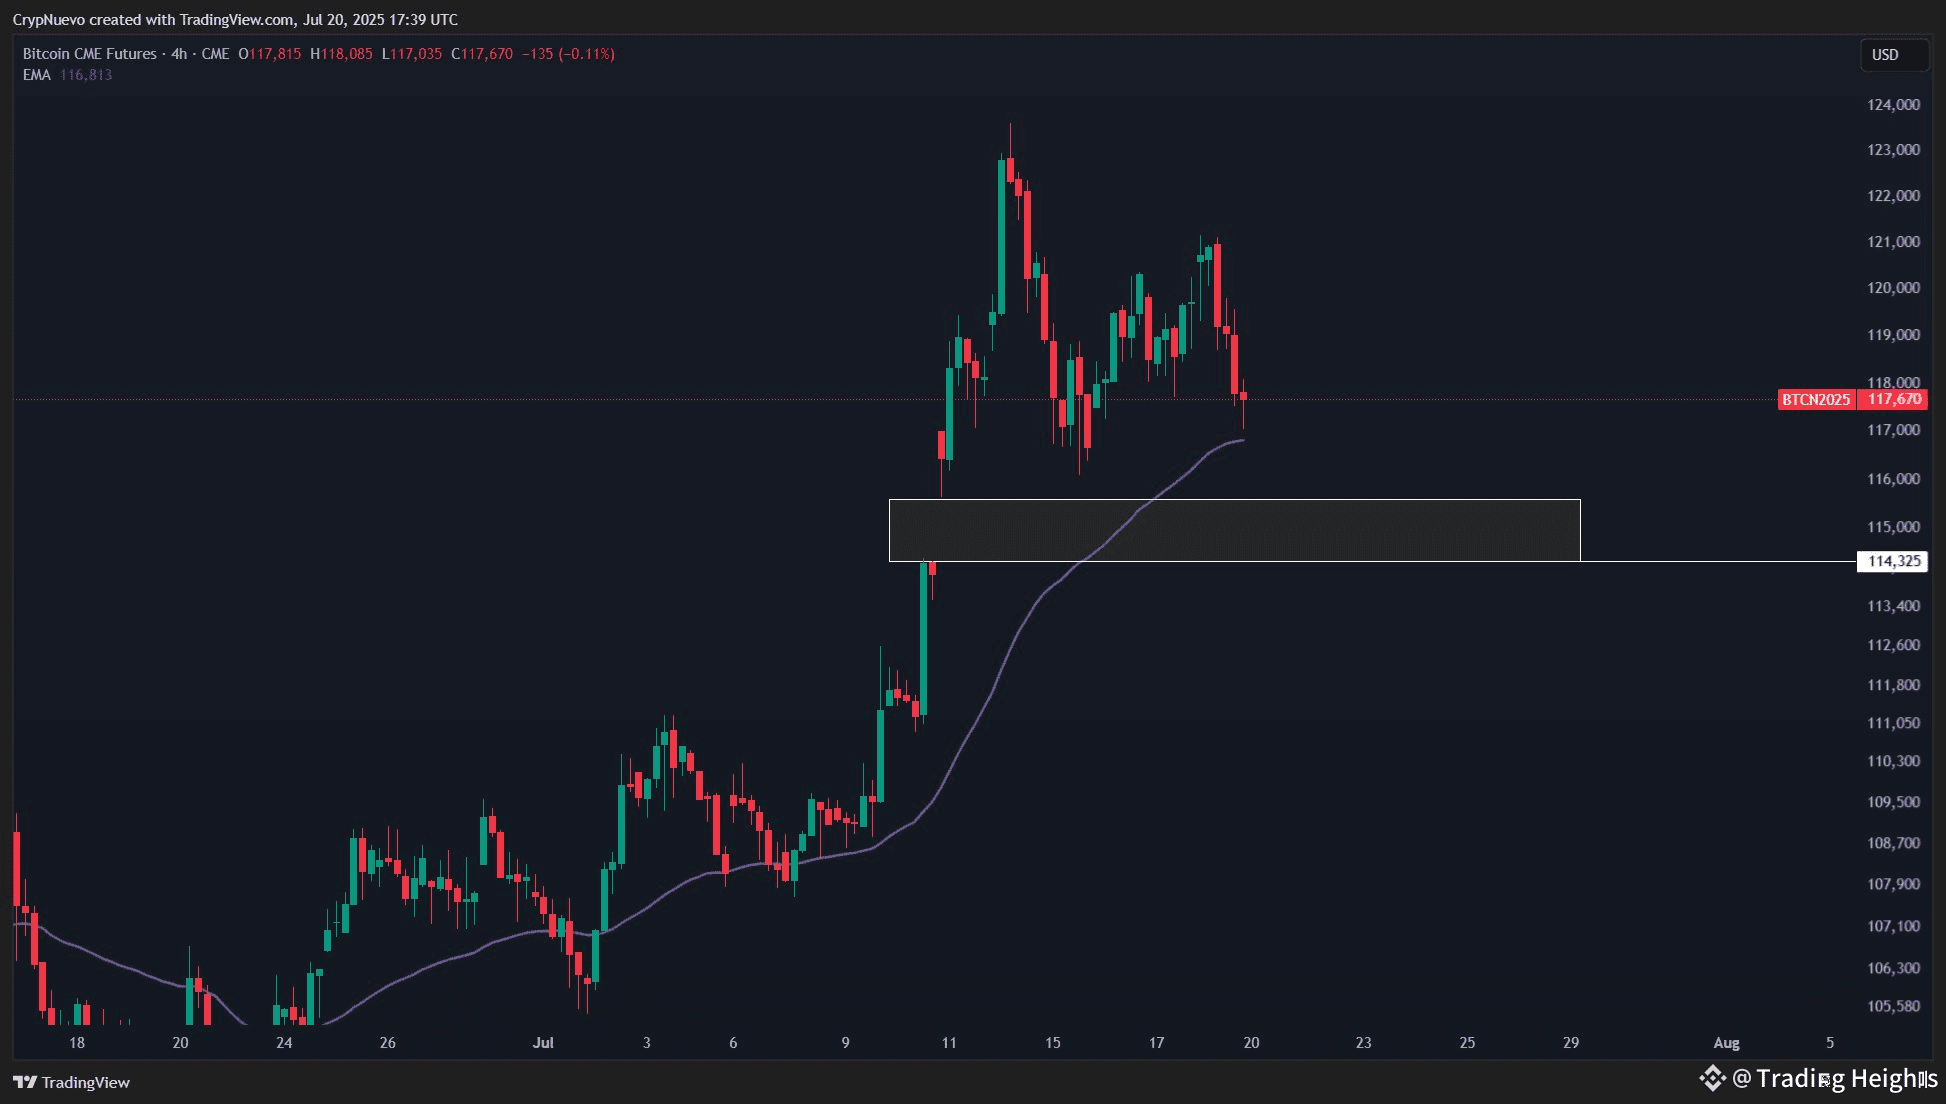
🔹 A CME gap exists at $114.3k
🔹 It's just below the $115.3k liquidation magnet
🔹 If the wick warning signal gets confirmed, expect a quick drop to this area
🔹 Would likely fill the gap, flush longs, and bounce
⚖️ Delta Analysis
🔹 Delta remains neutral
🔹 No signs of major short or long squeezes
🔹 Market in wait-and-watch mode — signs are subtle, but meaningful
📌 TL;DR
🔹 Market is in a strong HTF uptrend, but caution is advised
🔹 Watch for daily wicks without breakout = potential local top signal
🔹 Eyes on $115k - $114k zone for liquidation flush + gap fill
🔹 Let the next 2-3 daily candles guide the way 📅
⛓️ DYOR. Manage risk. The market never moves in a straight line. 💼📉📈
