1. Price Overview
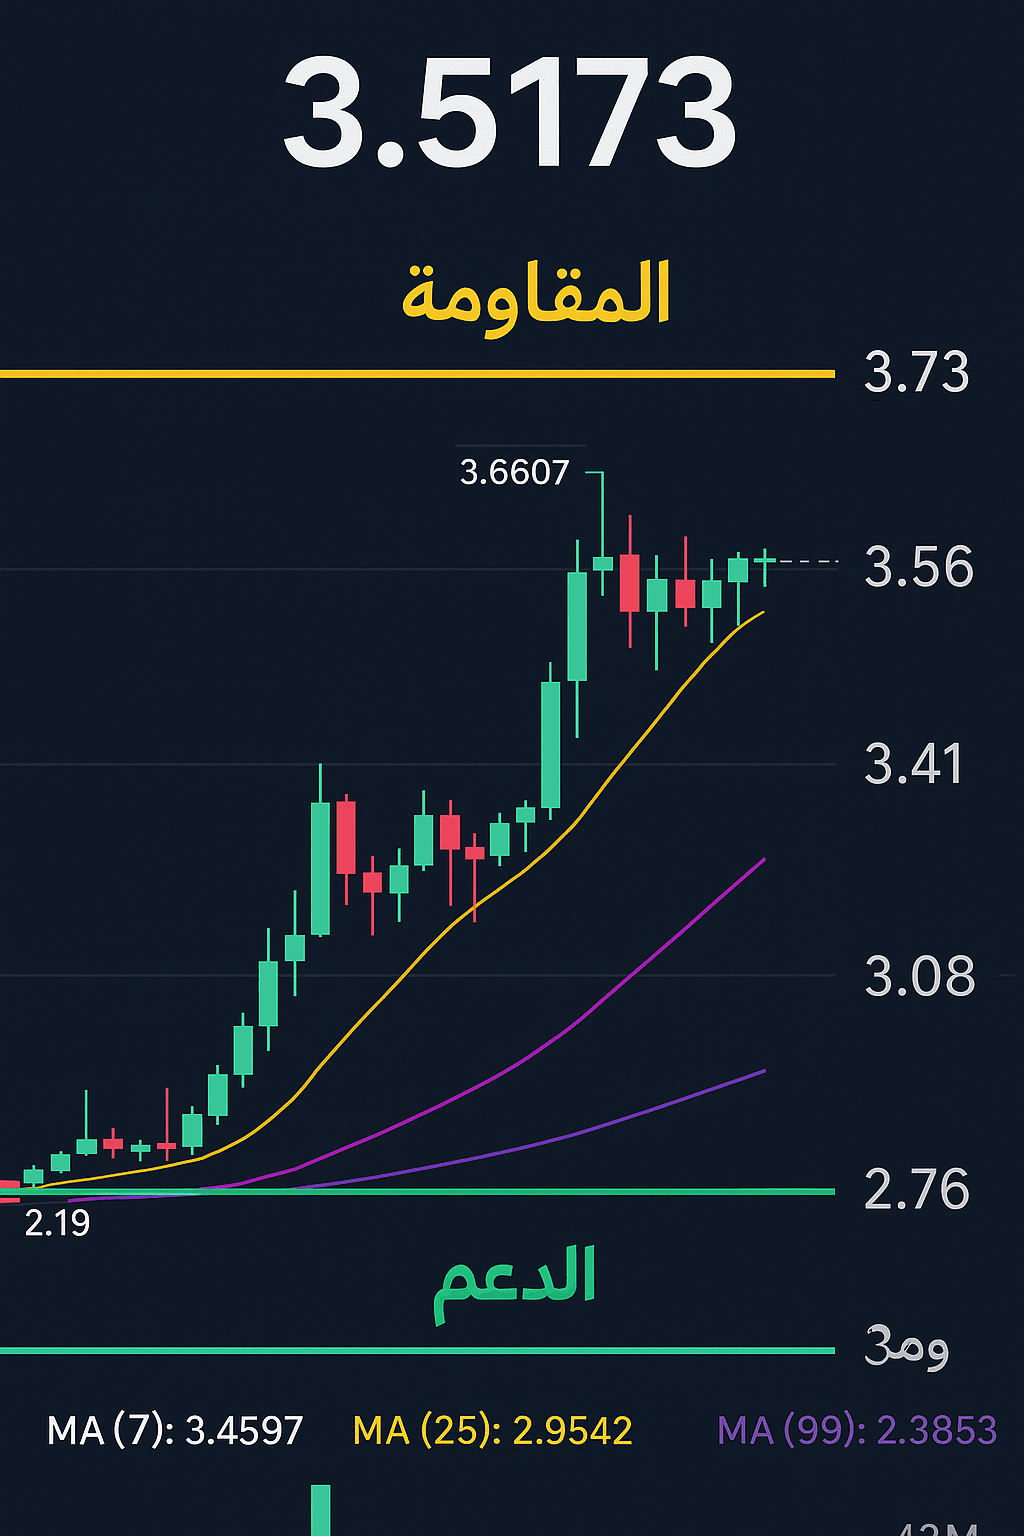
Current price: 3.5173 USDT.
Change in 24-hour percentage: +3.19%.
Highest price in 24 hours: 3.5352 USDT.
Lowest price in 24 hours: 3.3547 USDT.
---
2. General Trend
The trend has been strongly upward since breaking the 2.20 USDT level.
A local peak was recorded at 3.6607 USDT before a correction occurred.
The price is currently moving above the moving averages MA(7), MA(25), and MA(99), supporting the continuation of the upward trend.
---
3. Support and Resistance Levels
First support: 3.41 USDT (appears on the chart as a strong bounce point).
Second support: 3.08 USDT (near the moving average MA25).
Third support: 2.76 USDT (deeper support at the beginning of the last wave).
First resistance: 3.66 USDT (last peak).
Second resistance: 3.73 USDT (new historical peak if broken).
---
4. Reading Moving Averages (MA)
MA(7) = 3.4597 USDT: the price is above it, indicating positive short-term momentum.
MA(25) = 2.9542 USDT: the price is comfortably distant from it, reflecting the strength of the upward trend.
MA(99) = 2.3853 USDT: the long-term trend is strongly upward.
---
5. Momentum Indicators
The candle shapes indicate attempts to stabilize above 3.50 USDT.
Trading volume (Vol) is high: 15.77M XRP in the last 12 hours, indicating strong interest from buyers.
---
6. Possible Scenarios
Bullish Scenario:
If the price breaks 3.66 USDT with a 12-hour candle close, we may see the price heading towards 3.90 - 4.00 USDT.
Buying indicators are strong, especially if the current trading volume continues.
Bearish Scenario:
Breaking the support level of 3.41 USDT may push the price to correct towards 3.08 USDT.
Loss of buying momentum with the appearance of negative reversal candles will be a warning for profit-taking.
---
7. Technical Recommendation
Buy: Consider buying on any bounce above 3.40 USDT with a stop loss below 3.25 USDT.
Sell (Profit Taking): near the level of 3.65 – 3.70 USDT.
Day trader: Watch the close of the 12-hour candle, it is key to the upcoming trend.
